我有一些嘈杂的数据,每隔约1分钟记录一次,持续一天。
以下是一个简单的版本:
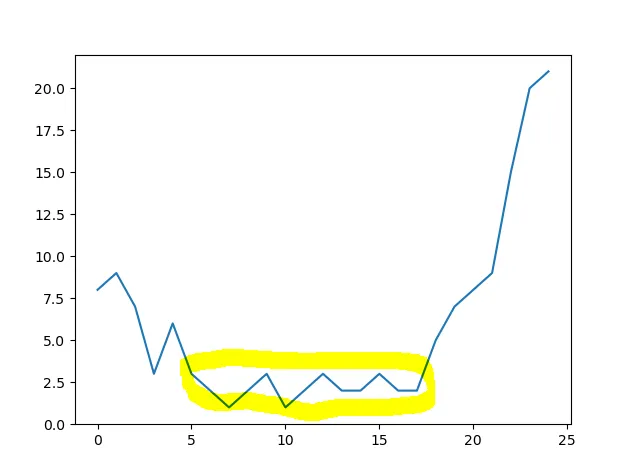
如何确定所标记黄色区域中较少噪声和较低数值的开始和结束索引值?
以下是测试数据:
import numpy as np
import pandas as pd
import matplotlib.pyplot as plt

arr = np.array([8,9,7,3,6,3,2,1,2,3,1,2,3,2,2,3,2,2,5,7,8,9,15,20,21])

plt.plot(arr)
plt.show()
我有一些嘈杂的数据,每隔约1分钟记录一次,持续一天。
以下是一个简单的版本:
如何确定所标记黄色区域中较少噪声和较低数值的开始和结束索引值?
以下是测试数据:
import numpy as np
import pandas as pd
import matplotlib.pyplot as plt
arr = np.array([8,9,7,3,6,3,2,1,2,3,1,2,3,2,2,3,2,2,5,7,8,9,15,20,21])
plt.plot(arr)
plt.show()
rolling方法应用此过程。std_thresh = 1
window_len = 5
s = pd.Series([8,9,7,3,6,3,2,1,2,3,1,2,3,2,2,3,2,2,5,7,8,9,15,20,21])
# Create a boolean mask which marks the less noisy points
marked = s.rolling(window=window_len).std() < std_thresh
# Whenever a new point is marked, mark also the other points of the window (see discussion below)
for i in range(window_len + 1, len(marked)):
if marked[i] and ~marked[i-1]:
marked[i - (window_len-1) : i] = True
plt.plot(s)
plt.scatter(s[marked].index, s[marked], c='orange')
window_len(计算标准差的窗口长度)和std_thresh(窗口标准差小于此值的点会被标记),并根据需要进行调整。rolling考虑以每个点结尾的窗口,因此,当你遇到一个噪声较少的段时,它们中的前window_len-1个点将不会被标记。这就是为什么在定义marked后,我在代码中包含了for循环的原因。对于给定的点,我们可以根据某些标准决定是否保留/屏蔽它:
注:由于你标记并导入了 pandas,我将使用 pandas 进行方便,但是同样的想法也可以用纯 numpy/matplotlib 实现。
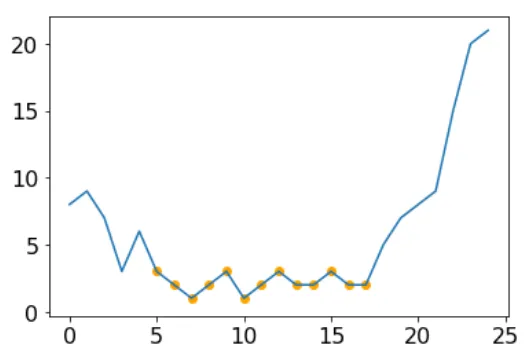
那么一个简单的方法是使用最小阈值的邻居差(但要注意实际数据中的异常值):
s = pd.Series(np.hstack([arr, arr]))

delta = 2
threshold = s.std()

# check if each point's neighbors are within `delta`
mask_delta = s.diff().abs().le(delta) & s.diff(-1).abs().le(delta)

# check if each point is within `threshold` of the minimum
mask_threshold = s < s.min() + threshold

s.plot(label='raw')
s.where(mask_threshold & mask_delta).plot(marker='*', label='delta & threshold')
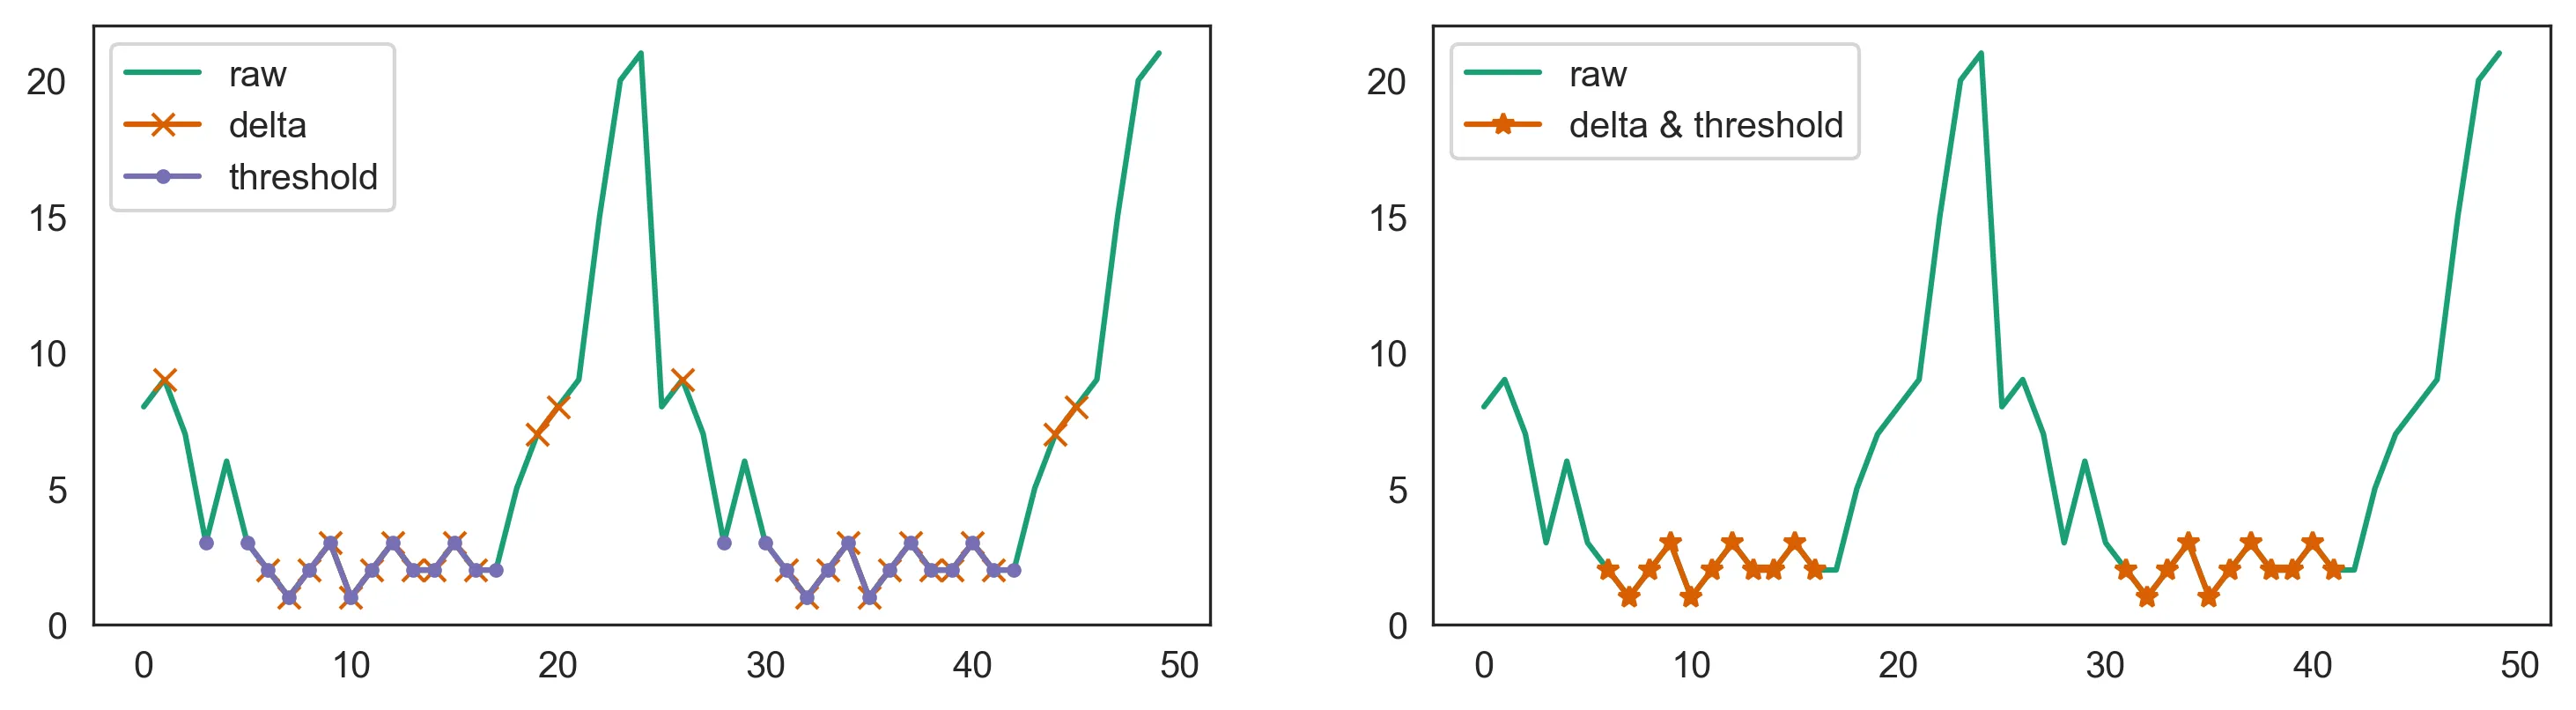
那么全局最小阈值将无法奏效,因为一些时期会太高。在这种情况下,请尝试使用带有连续块的相邻增量:
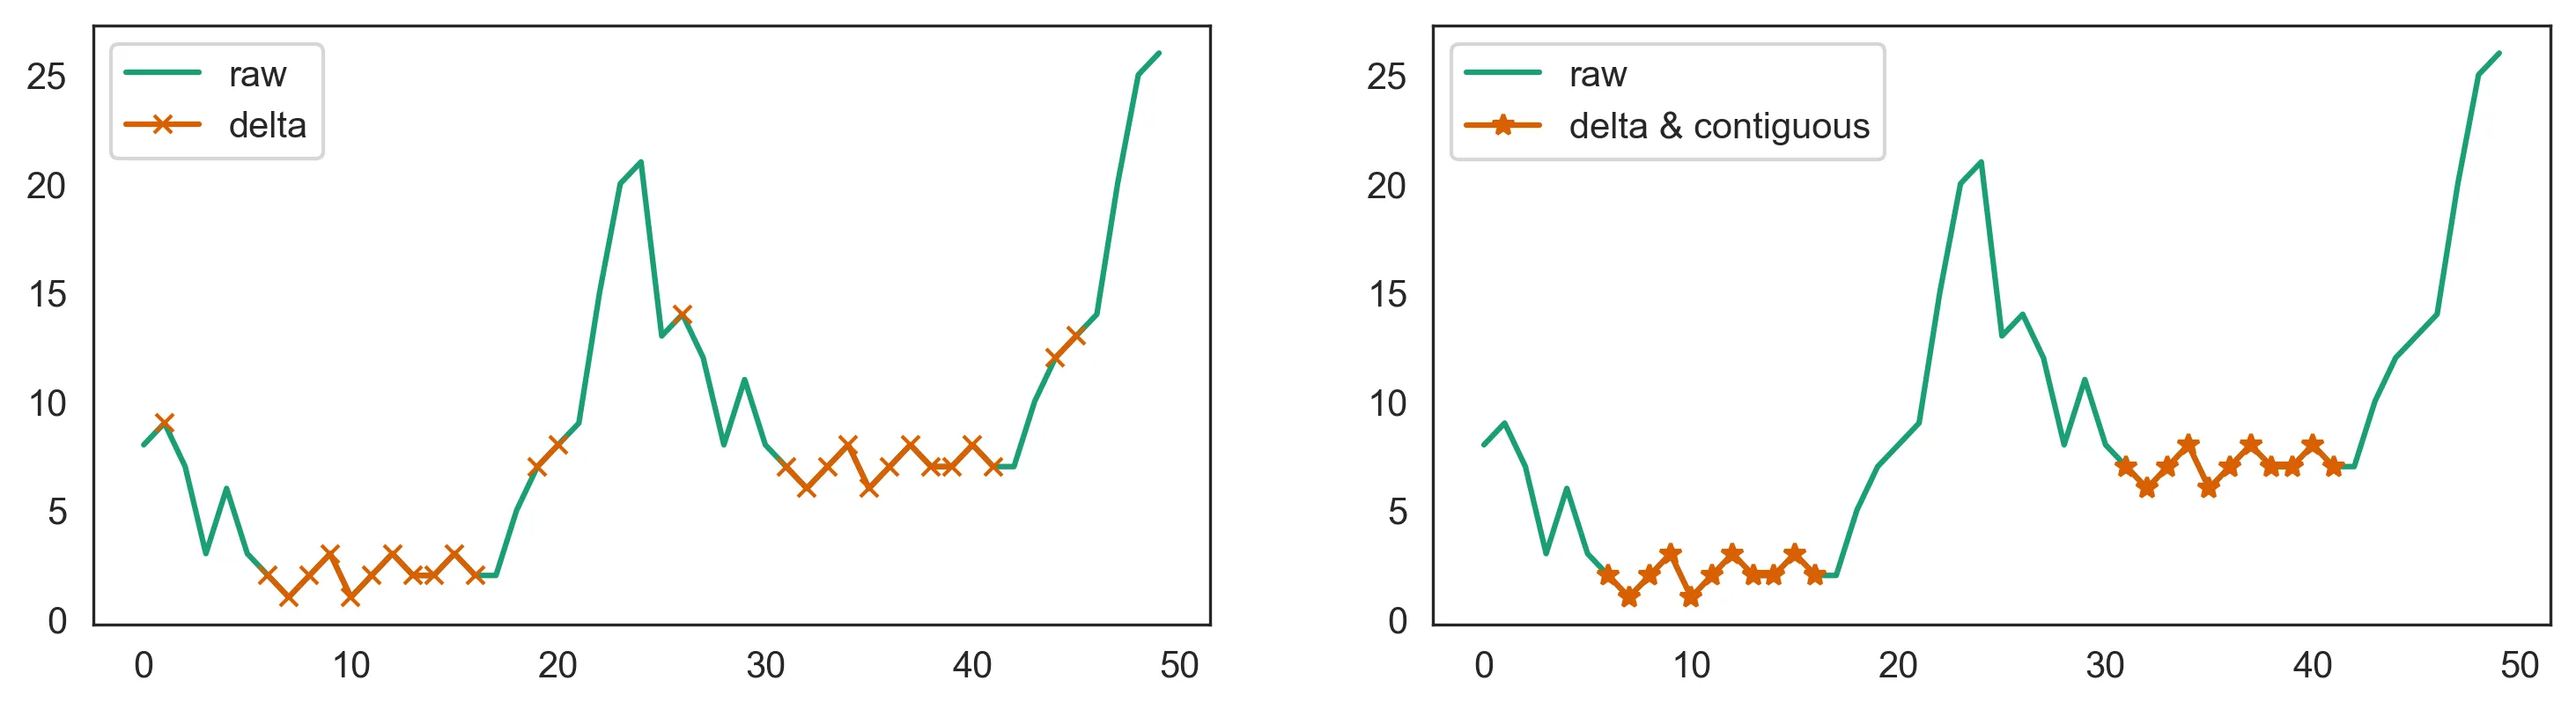
# shift the second period by 5
s = pd.Series(np.hstack([arr, arr + 5]))

delta = 2
blocksize = 10

# check if each point's neighbors are within `delta`
mask_delta = s.diff().abs().le(delta) & s.diff(-1).abs().le(delta)

# check if each point is in a contiguous block of at least `blocksize`
masked = s.where(mask_delta)
groups = masked.isnull().cumsum()
blocksizes = masked.groupby(groups).transform('count').mask(masked.isnull())
mask_contiguous = blocksizes >= blocksize

s.plot(label='raw')
s.where(mask_contiguous).plot(marker='*', label='delta & contiguous')
嗯,如果你只是想要那个“区域”,你需要找到在特定范围内的点的方法。我们该怎么做呢?嗯,我们可能应该首先找到数组中的最小值,然后找出该数组中其他在指定偏差范围内的数值:
def lows(arr, dev=0):
    lim = min(arr) + dev
    pts = []
    for i,e in enumerate(arr):
        if e <= lim:
            pts.append((i,e))
    return pts
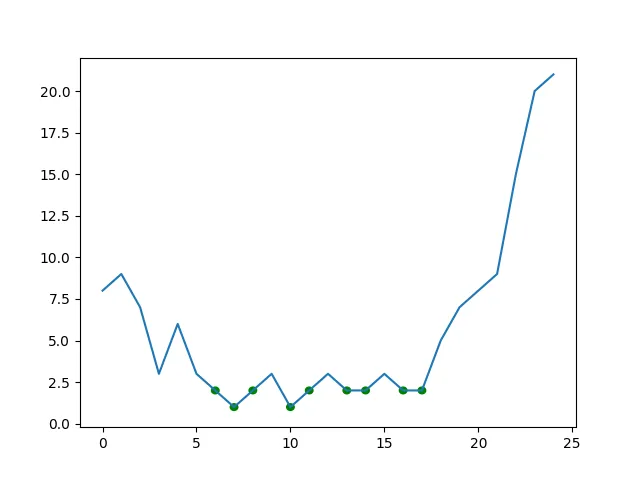
上述函数返回一个在指定范围内的点列表。下限是输入数组的最小值,上限是最小值加上您提供的偏差。例如,如果您想要所有低于最小值1的点:
plt.plot(arr)
for pt in lows(arr, 1):
    circle = plt.Circle(pt, 0.2, color='g')
    plt.gca().add_patch(circle)
plt.show()