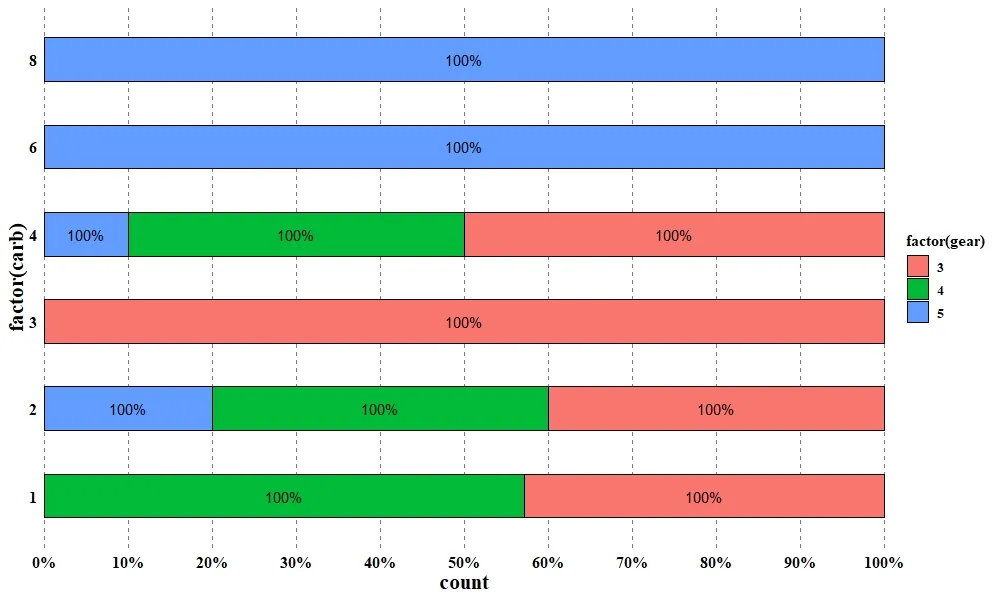
我想要一个堆积条形图,并且在上面显示百分比,基于计数得到。我已经接近达到我的目标,但是文本中的每个值都是100%,而不是实际的百分比...我认为我的代码有一个小错误,但我找不到它。
ggplot(
  mtcars,
  aes(fill = factor(gear),
      x = factor(carb))
) +
  geom_bar(stat = "count",
           position = "fill",
           color = "black",
           width = 0.5) +
  geom_text(aes(label = scales::percent(..prop..)),
            position = position_fill(vjust = 0.5),
            stat = "count") +
  coord_flip()
stat = "identity"。但是谢谢! - TobiSonne