如何使用geom_text在堆积条形图中显示数值?

4
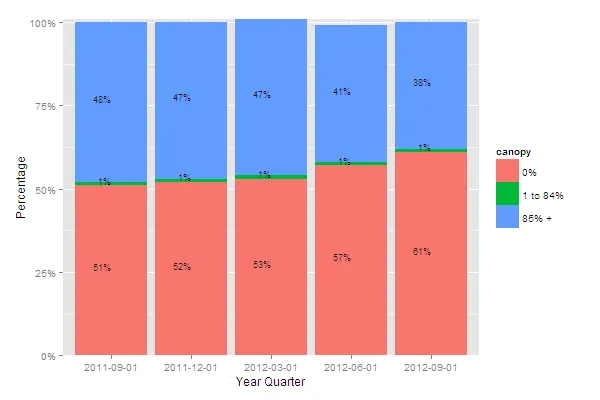
我想在堆叠条形图中显示百分比数字,但是其中一个组的百分比非常低。两个值重叠在一起。我尝试更改为 'postion='identity',但仍然无法解决问题... 有什么建议吗?
x4.can.m <- structure(list(canopy = structure(c(1L, 2L, 3L, 1L, 2L, 3L, 1L, 
2L, 3L, 1L, 2L, 3L, 1L, 2L, 3L), .Label = c("0%", "1 to 84%", 
"85% +"), class = "factor"), YearQuarter = structure(c(1L, 1L, 
1L, 2L, 2L, 2L, 3L, 3L, 3L, 4L, 4L, 4L, 5L, 5L, 5L), .Label = c("2011-09-01", 
"2011-12-01", "2012-03-01", "2012-06-01", "2012-09-01"), class = "factor"), 
    value = c(0.51, 0.01, 0.48, 0.52, 0.01, 0.47, 0.53, 0.01, 
    0.47, 0.57, 0.01, 0.41, 0.61, 0.01, 0.38)), .Names = c("canopy", 
"YearQuarter", "value"), row.names = c(NA, -15L), class = "data.frame")


x4.can.bar <- ggplot(data=x4.can.m, aes(x=factor(YearQuarter), y=value,fill=canopy)) + geom_bar(stat="identity",position = "stack",ymax=100)

x4.can.bar+scale_y_continuous(formatter='percent')+
 labs(y="Percentage",x="Year Quarter") + 
 geom_text(aes(label =paste(round(value*100,0),"%",sep="")),size = 3, hjust = 0.5, vjust = 4,position ="identity")
2个回答

11

你需要为标签的放置指定合理的值-如果您在ggplot调用之外这样做,将比尝试在调用内部这样做要容易得多。

您可以通过取堆叠组件的中点来实现此目的。

使用plyrddply,只需将累积总和减去每个YearQuarter中当前值的一半即可。

library(plyr)
x4.can.m <- ddply(x4.can.m, .(YearQuarter), mutate, csum = cumsum(value)-value/2)

x4.can.bar <- ggplot(data=x4.can.m, aes(x=factor(YearQuarter), y=value,fill=canopy)) +  
 geom_bar(stat="identity",position = "stack",ymax=100)

x4.can.bar + 
 scale_y_continuous(expand = c(0,0), labels = percent) +
 labs(y="Percentage",x="Year Quarter")+
 geom_text(aes(y = csum,label =paste(round(value*100,0),"%",sep="")),
           size = 3, hjust = 1, vjust = 0)
注意,我正在使用 ggplot2_0.9.2.1,因此formatter不再是scale_y_continuous的有效参数,而是用label = percent 代替。请参见这个问题和相关链接。

enter image description here


@mnel,谢谢。升级到ggplot2_0.9.2.1最简单的方法是什么?我还在使用R_2.15.1..... - Luo Lei
在一个新的 R 会话中运行 install.packages('ggplot2') - mnel
R_2.15.0.2中的melt()函数消失了吗? - Luo Lei
ggplot2 用于将 reshape2 加载到搜索路径中,新版本使用 import 命令导入 reshape2,以便在 ggplot2 中使用函数。如果需要显式加载,请运行 library(reshape2) - mnel

8

一种解决方案是将堆栈条更改为闪避式。

x4.can.bar <- ggplot(data=x4.can.m, aes(x=factor(YearQuarter), y=value,fill=canopy)) + 
                    geom_bar(stat="identity",position = "dodge",ymax=100) +
             geom_text(aes(label =paste(round(value*100,0),"%",sep=""),ymax=0), 
                       position=position_dodge(width=0.9), vjust=-0.25)
x4.can.bar

enter image description here


网页内容由stack overflow 提供, 点击上面的
可以查看英文原文,
原文链接