我刚接触ggplot2(和R),正在尝试制作一个填充的条形图,每个方块内都有标签指示组成该块的百分比。
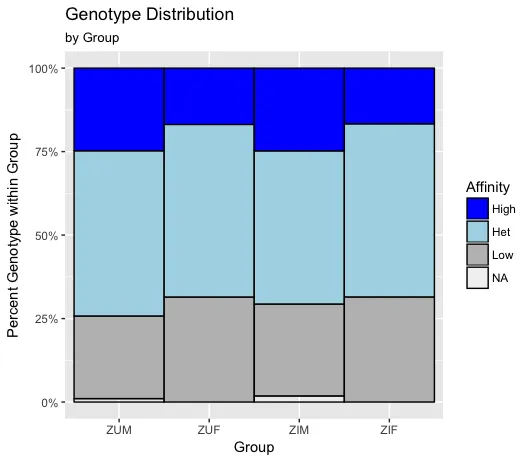
这是我当前图表的示例,我想添加标签:
##ggplot figure
library(gpplot2)
library(scales)

#specify order I want in plots
ZIU$Affinity=factor(ZIU$Affinity, levels=c("High", "Het", "Low"))
ZIU$Group=factor(ZIU$Group, levels=c("ZUM", "ZUF", "ZIM", "ZIF"))

ggplot(ZIU, aes(x=Group))+
geom_bar(aes(fill=Affinity), position="fill", width=1, color="black")+
scale_y_continuous(labels=percent_format())+
scale_fill_manual("Affinity", values=c("High"="blue", "Het"="lightblue", "Low"="gray"))+
labs(x="Group", y="Percent Genotype within Group")+
ggtitle("Genotype Distribution", "by Group")
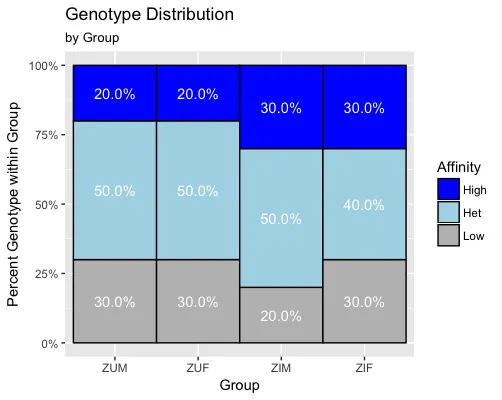
我尝试使用以下代码添加标签,但它不断产生错误消息“Error: geom_text requires the following missing aesthetics: y”,但我的图没有y美学,这是否意味着我不能使用geom_text?(另外,我不确定一旦y美学问题得到解决,geom_text语句的其余部分是否会实现我所需的,在每个框中心的白色标签。)
ggplot(ZIU, aes(x=Group)) +
geom_bar(aes(fill=Affinity), position="fill", width=1, color="black")+
geom_text(aes(label=paste0(sprintf("%.0f", ZIU$Affinity),"%")),
    position=position_fill(vjust=0.5), color="white")+
scale_y_continuous(labels=percent_format())+
scale_fill_manual("Affinity", values=c("High"="blue", "Het"="lightblue", "Low"="gray"))+
labs(x="Group", y="Percent Genotype within Group")+
ggtitle("Genotype Distribution", "by Group")
此外,如果有人对消除NA值有建议,将不胜感激!我尝试过。
geom_bar(aes(fill=na.omit(Affinity)), position="fill", width=1, color="black")
但是出现了错误:"错误:美学必须是长度为1或与数据相同(403):填充,x"
 dput(sample)
 structure(list(Group = structure(c(3L, 3L, 3L, 3L, 3L, 3L, 3L,
 3L, 3L, 3L, 4L, 4L, 4L, 4L, 4L, 4L, 4L, 4L, 4L, 4L, 1L, 1L, 1L,
 1L, 1L, 1L, 1L, 1L, 1L, 1L, 2L, 2L, 2L, 2L, 2L, 2L, 2L, 2L, 2L,
 2L), .Label = c("ZUM", "ZUF", "ZIM", "ZIF"), class = "factor"),
StudyCode = c(1, 2, 3, 4, 5, 6, 20, 21, 22, 23, 143, 144,
145, 191, 192, 193, 194, 195, 196, 197, 10, 24, 25, 26, 27,
28, 71, 72, 73, 74, 274, 275, 276, 277, 278, 279, 280, 290,
291, 292), Affinity = structure(c(3L, 2L, 1L, 2L, 3L, 1L,
1L, 2L, 2L, 2L, 2L, 2L, 3L, 2L, 3L, 2L, 3L, 1L, 1L, 1L, 3L,
2L, 1L, 2L, 2L, 1L, 2L, 2L, 3L, 3L, 2L, 1L, 3L, 2L, 1L, 3L,
3L, 2L, 2L, 2L), .Label = c("High", "Het", "Low"), class = "factor")), .Names = c("Group",
"StudyCode", "Affinity"), row.names = c(NA, 40L), class = c("tbl_df",
"tbl", "data.frame"))
非常感谢!
dput(data_sample)的输出粘贴到你的问题中。 - eipi10