如何在使用ggplot绘制的分面堆积条形图中,为geom_text()添加不同的标签?

4
我正在尝试在堆叠条形图中使用facet_wrap,并且希望在条上显示每个部分的值标签。
以钻石数据集为例:
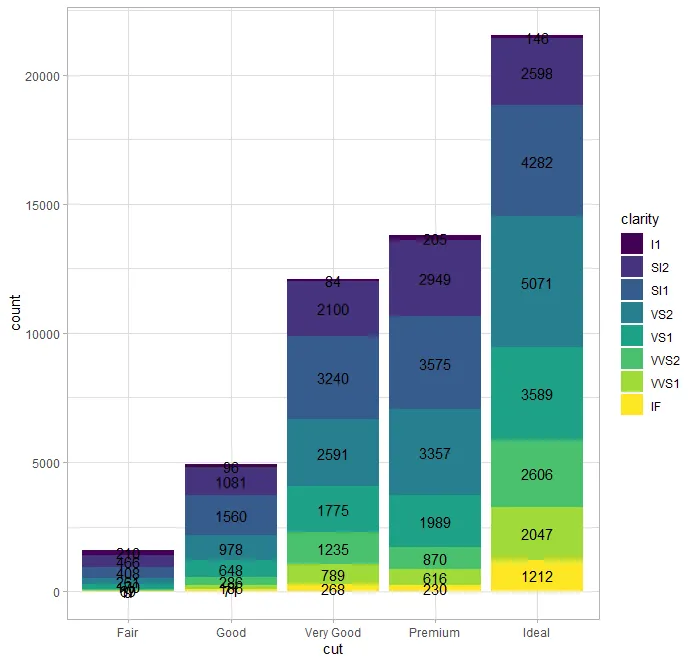
当只有一个图形时,我的geom_text代码可以正常工作,尽管对于较短的条形图来说可能有点拥挤:
diamonds %>%
ggplot(aes(x = cut, fill = clarity)) +
geom_bar() +
geom_text(data = . %>% 
          group_by(cut, clarity) %>%
          tally() %>%
          ungroup() %>% 
          group_by(cut) %>%
          ungroup(),
        aes(y = n, label = n),
        position = position_stack(0.5),
        show.legend = FALSE) 

未分面的标记条形图

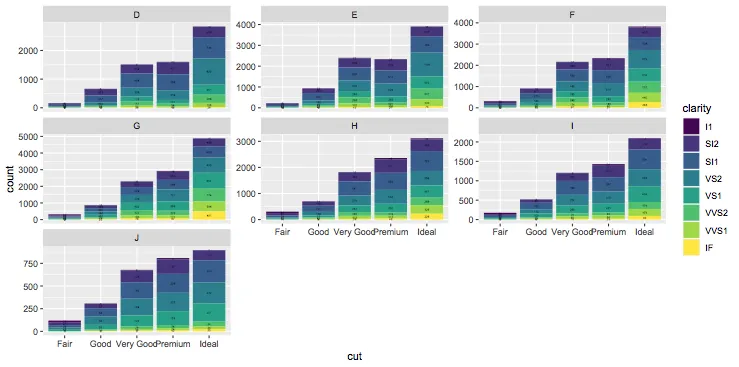
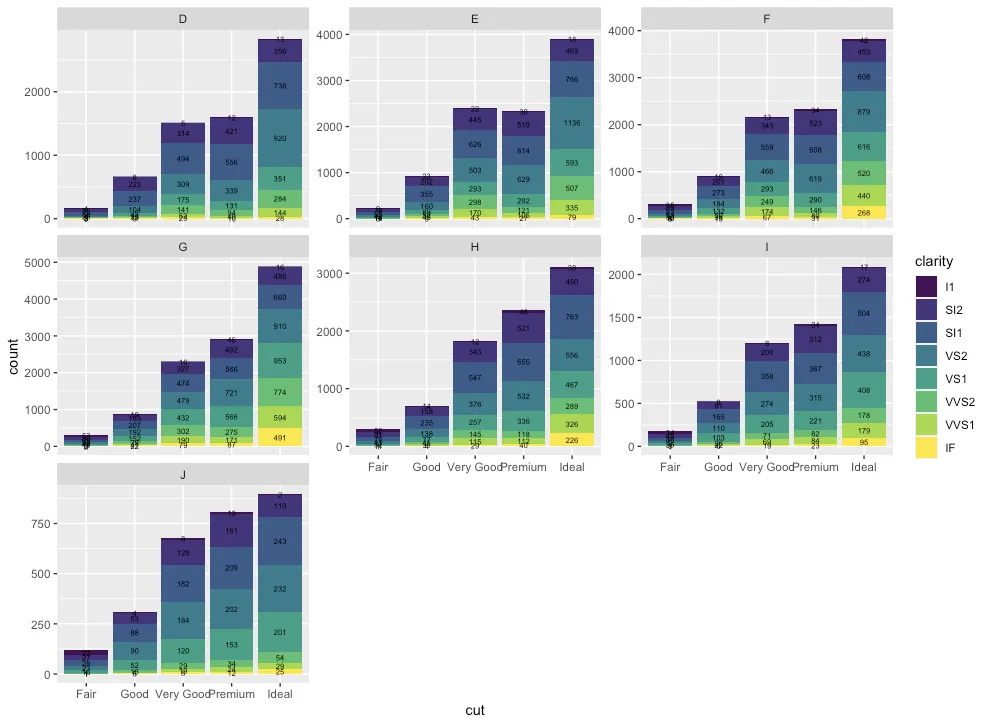
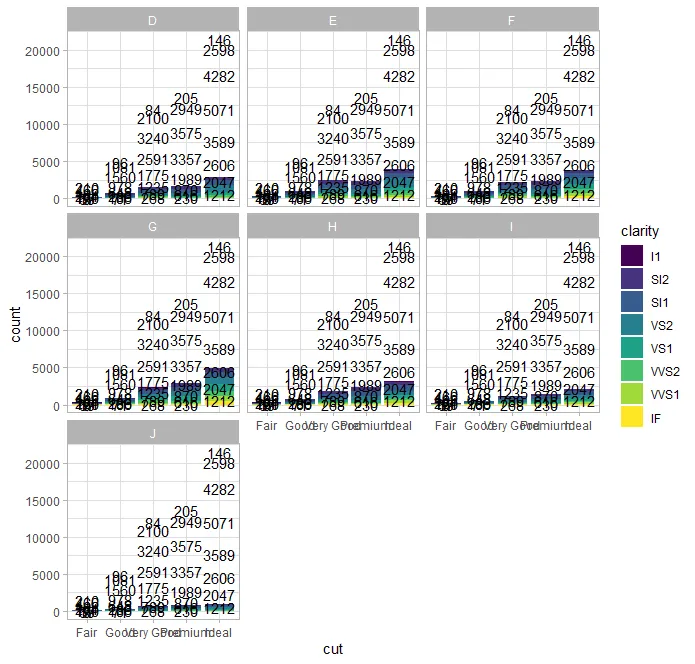
然而,当我添加分面时,所有标签都显示在各个单独的分面中:

diamonds %>%
  ggplot(aes(x = cut, fill = clarity)) +
  geom_bar() +
  facet_wrap(~ color) +
  geom_text(data = . %>% 
              group_by(cut, clarity) %>%
              tally() %>%
              ungroup() %>% 
              group_by(cut) %>%
              ungroup(),
            aes(y = n, label = n),
            position = position_stack(0.5),
            show.legend = FALSE)

带有复制标签的多面棱柱条形图

如何使标签仅出现在相关的条形上?

谢谢!

2个回答

3

我认为你需要在 group_by + tally 中包含颜色,这样它才能被分配到正确的 facet 中:

diamonds %>%
ggplot(aes(x = cut, fill = clarity)) +
geom_bar() +
facet_wrap(~ color,scale="free_y") +
geom_text(data = . %>% 
          count(cut, clarity,color),
            aes(y = n, label = n),size=1,
            position = position_stack(0.5),
            show.legend = FALSE)

enter image description here


在 group_by + tally 中包含颜色完美地工作了,谢谢! - Giselle Sleapy

3

个人而言,我发现特殊变量..count..更易于处理。

diamonds %>%
ggplot(aes(x = cut, fill = clarity)) +
  geom_bar() +
  facet_wrap(~ color,scale="free_y") +
  stat_count(geom = "text", 
             aes(y =..count.., label = ..count..),
             position=position_stack(0.5), size = 2)

enter image description here


网页内容由stack overflow 提供, 点击上面的
可以查看英文原文,
原文链接