这是我的示例数据。我想在一个图中绘制y1和y2相对于x1的关系。我做了以下操作:
library(ISLR)
library(ggplot2)

y1<-scale(Auto$horsepower,scale = T,center=T)
y2<-scale(Auto$weight,scale = T,center=T)
x1<-Auto$mpg
df<-data.frame(y1,y2,x1)

p<-ggplot(df,aes(x=x1)) +
   geom_point(aes(y = y1), shape = 16) +
   geom_point(aes(y = y2), shape = 2)
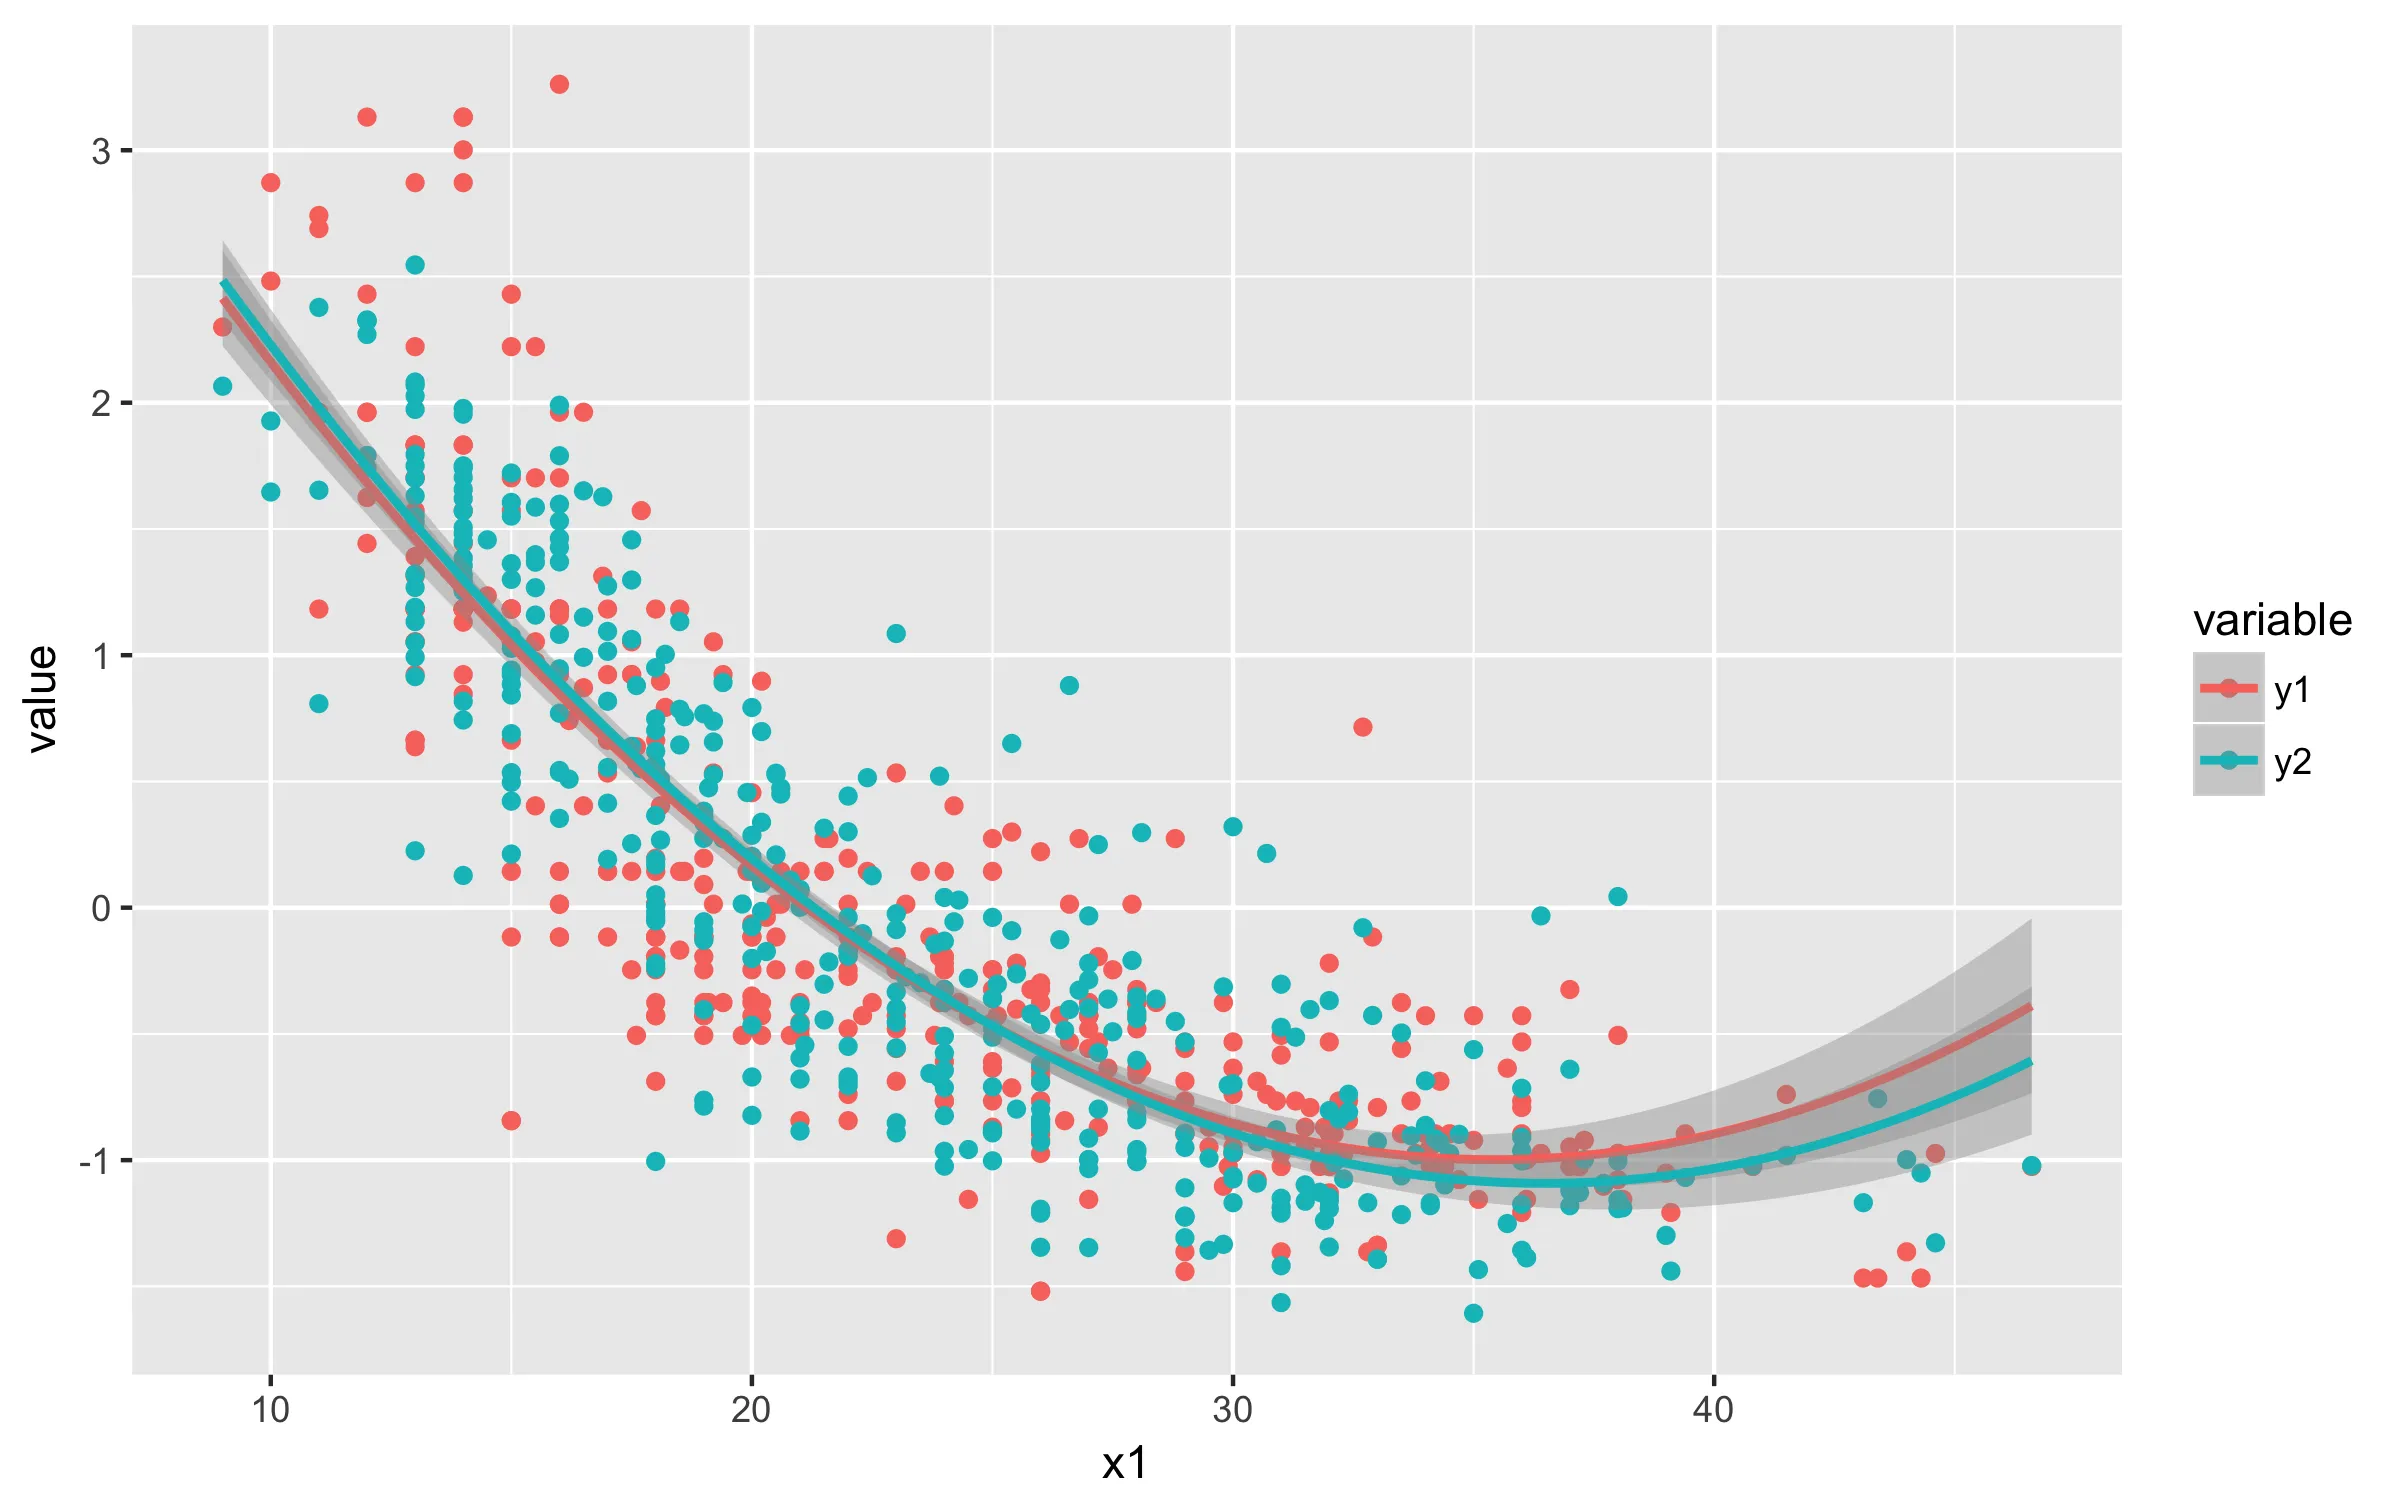
我希望为y1和y2针对x插入一个二次线。我已经这样做了:
p + stat_smooth(method = "lm", formula = y ~ x + I(x^2), size = 1)
它抛出了一个错误:
Warning message:
Computation failed in `stat_smooth()`:
variable lengths differ (found for 'x')
除此之外,stat_smooth命令只会生成一条二次线,而我需要分别为y1和y2生成两条二次线。
我该如何在R中实现这个目标?
谢谢。