我有100多个文件,其中的数据趋势几乎相同。我已经成功地为它们获得了最佳拟合度,但现在我想将其与理论论证进行比较。换句话说,我想生成一个方程,用于基于实验数据生成的最佳拟合曲线;该方程将适用于特定范围内的任何随机值,并产生类似的曲线,当然会有一些误差。
代码:
或者使用以下的
我想知道它的方程,或者说这个曲线的一些参数(系数、标准误差值等)。
代码:
set.seed(42)
x <-sort(round(runif(10,0,53)))   ## random x values
y <- runif(10,0,400)              ## random y values
data1 <-  data.frame(y=y,x=x)     ## creating a data frame
现在我可以像下面这样使用lattice:
library(lattice)
library(latticeExtra)
xyplot(y ~ x,data=data1,par.settings = ggplot2like(),
                   panel = function(x,y,...){
                     panel.xyplot(x,y,...)
                   })+ layer(panel.smoother(y ~ x, se = FALSE, span = 0.5))
或者使用以下的
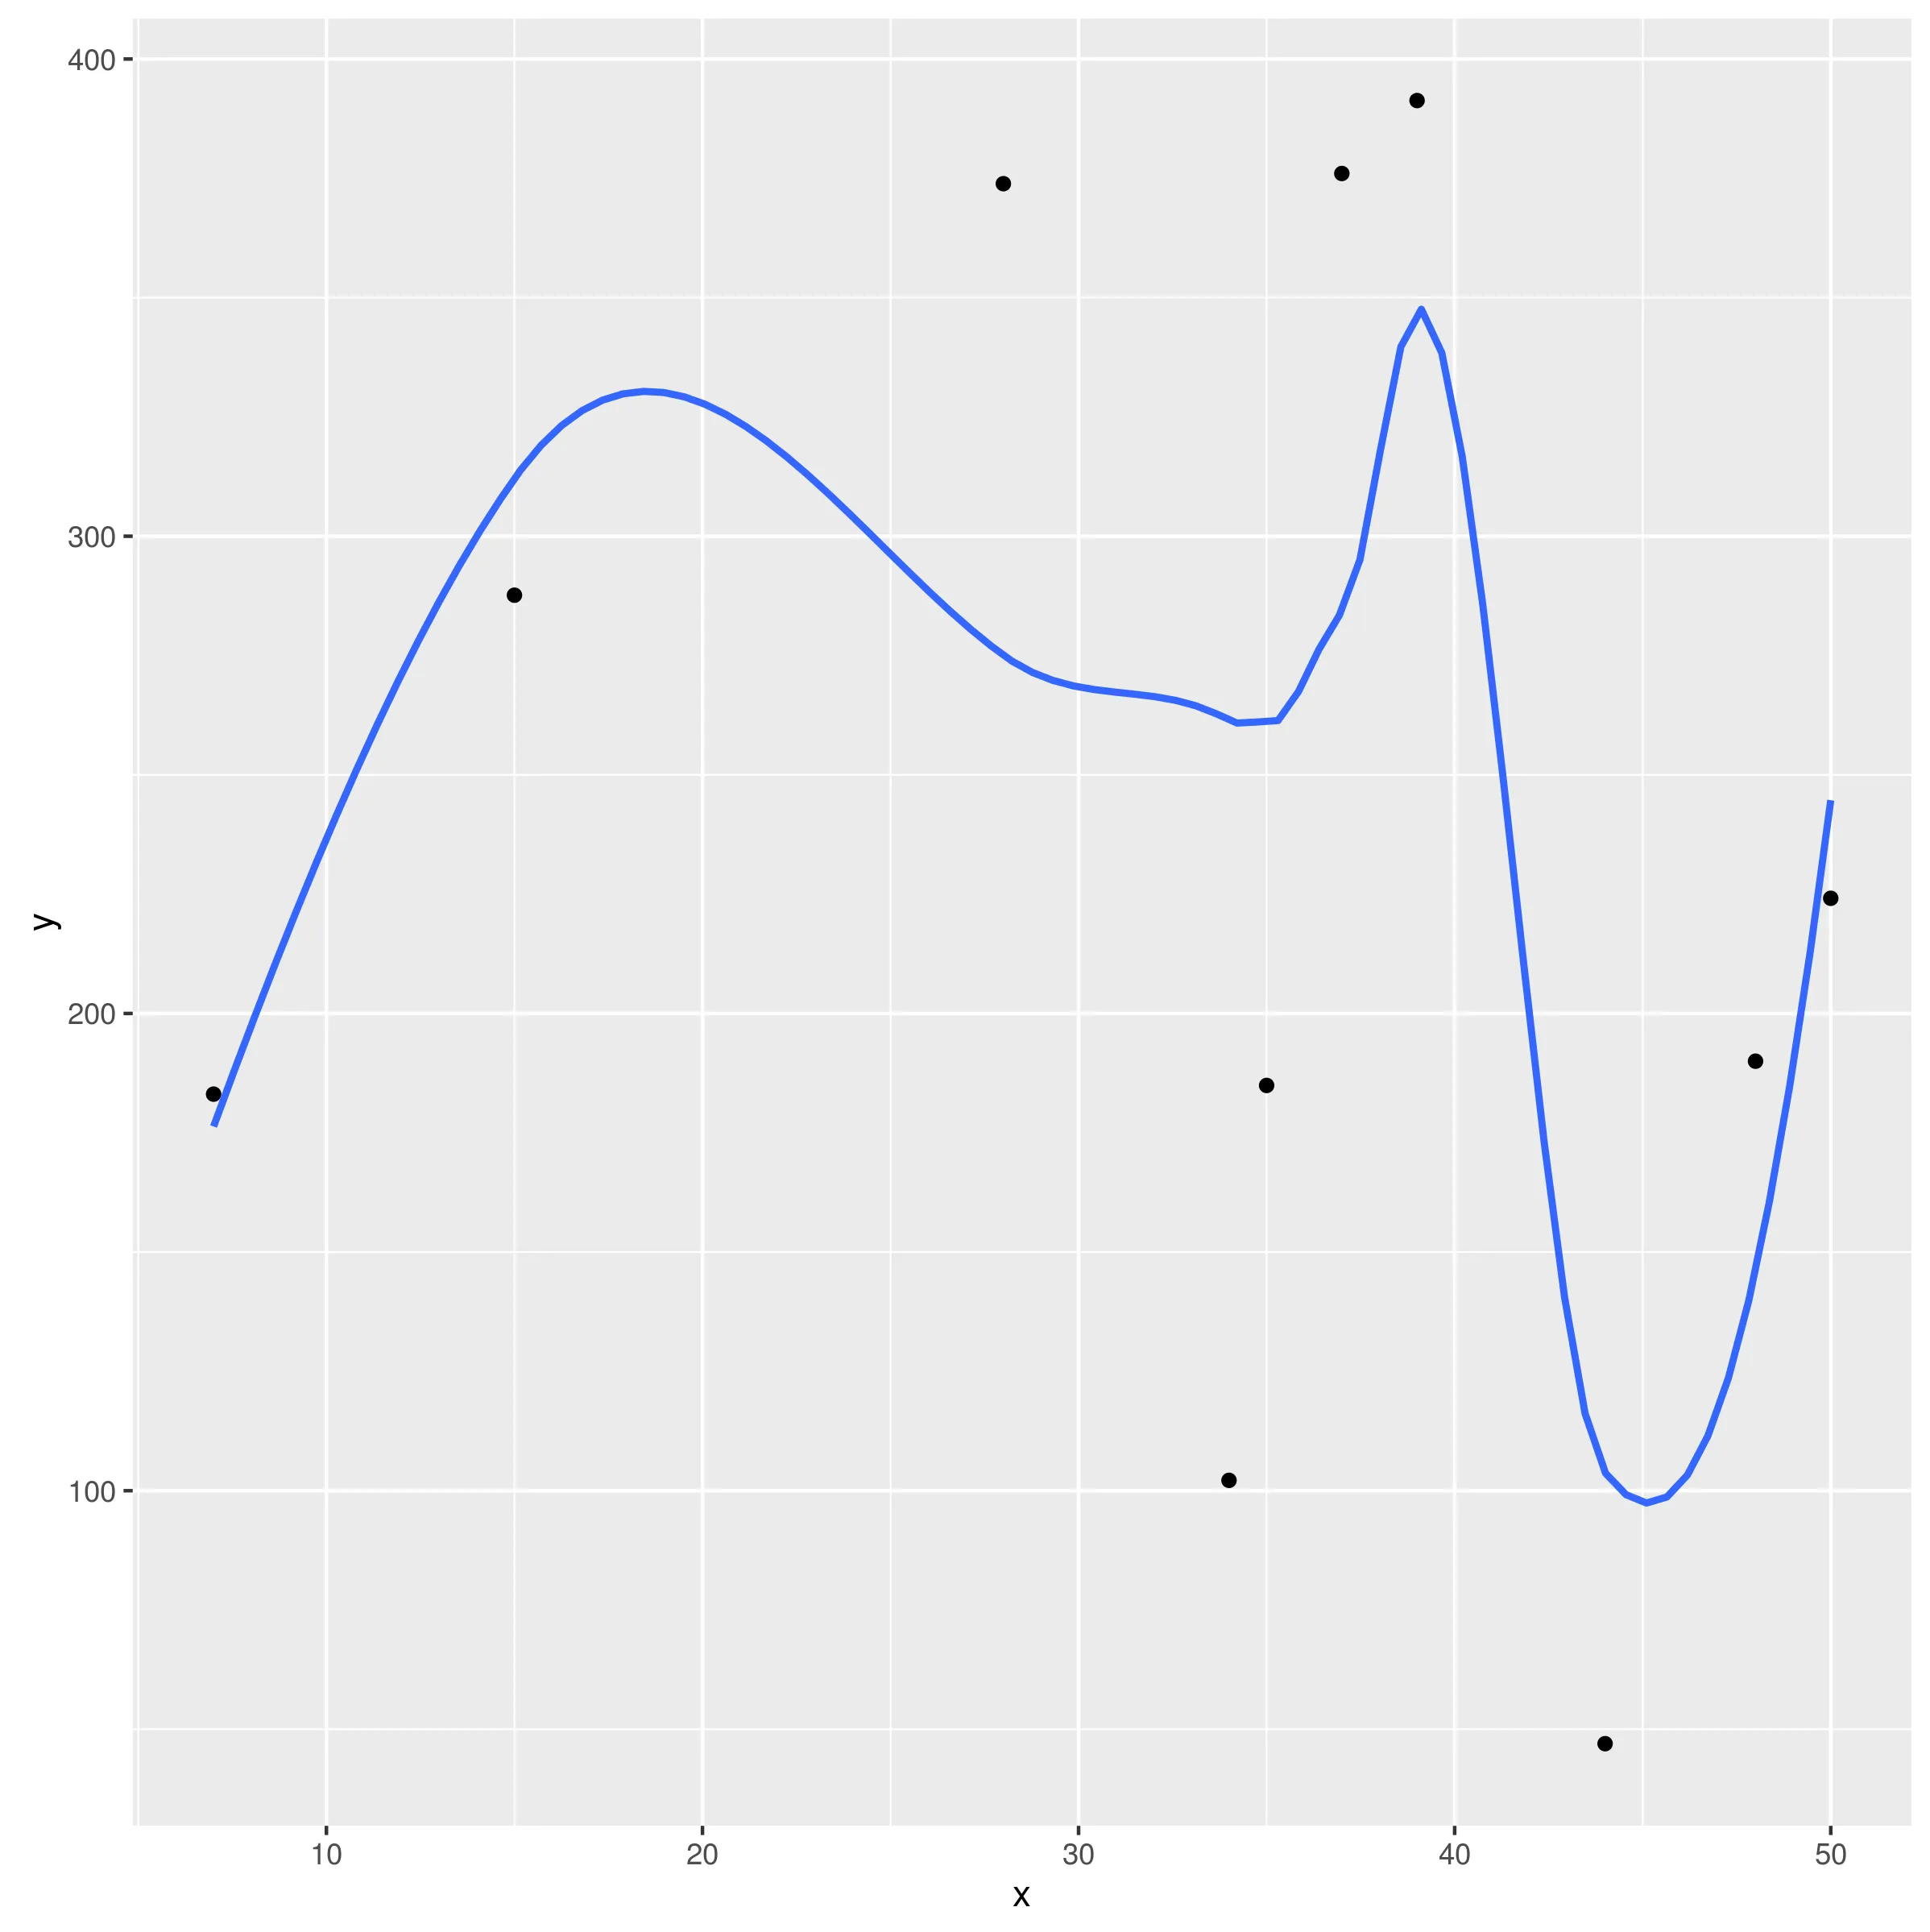
ggplot:library(ggplot2)
ggplot(data1, aes(x=x, y=y)) + geom_point() + geom_smooth(se = FALSE)
我想知道它的方程,或者说这个曲线的一些参数(系数、标准误差值等)。