我有一个带有曲线信息的df:
df <- data.frame(
  x = c(0,0,1,1),
  xend = c(0,1,1,0),
  y = c(0,1,0,1),
  yend = c(1,0,1,1),
  curvature = c(-.2,-.5,.1,1)
)
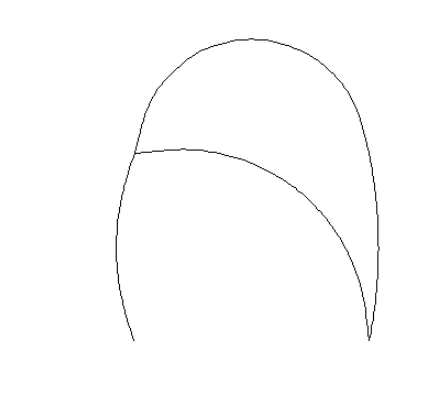
我可以使用单独的曲率参数绘制这些曲线(灵感来自此处):
library(ggplot2)
ggplot(df) +
  lapply(split(df, 1:nrow(df)), function(dat) {
    geom_curve(data = dat, aes(x = x, y = y, xend = xend, yend = yend), curvature = dat["curvature"]) }
  ) + xlim(-1,2) + ylim(-1,2) + theme_void()
起初,我以为我可能能够使用我的
gg对象中的信息,但无法看到ggplot2存储信息的位置(请参见我的问题here)。然后我尝试使用以下方法重新调整起点和终点:
offset <- function(from, to) return((to - from)/10)

recalculate_points <- function(df) {
  df$x <- df$x + offset(df$x, df$xend)
  df$xend = df$xend - offset(df$x, df$xend)
  df$y = df$y + offset(df$y, df$yend)
  df$yend = df$yend - offset(df$y, df$yend)
  return(df)
}

df2 <- recalculate_points(df)

ggplot(df) +
  lapply(split(df, 1:nrow(df)), function(dat) {
    geom_curve(data = dat, aes(x = x, y = y, xend = xend, yend = yend), curvature = dat["curvature"]) }
  )  +
  lapply(split(df2, 1:nrow(df2)), function(dat) {
    geom_curve(data = dat, aes(x = x, y = y, xend = xend, yend = yend), curvature = dat["curvature"], color = "red") }
  ) + xlim(-1,2) + ylim(-1,2) + theme_void()
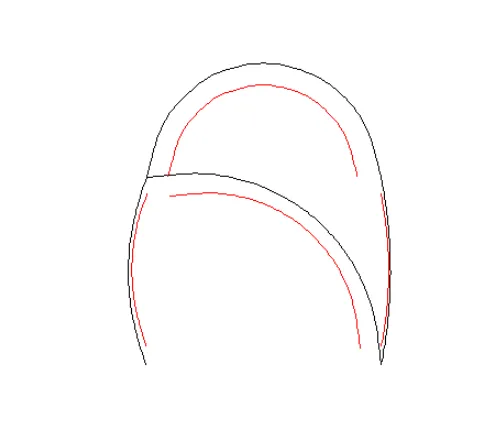
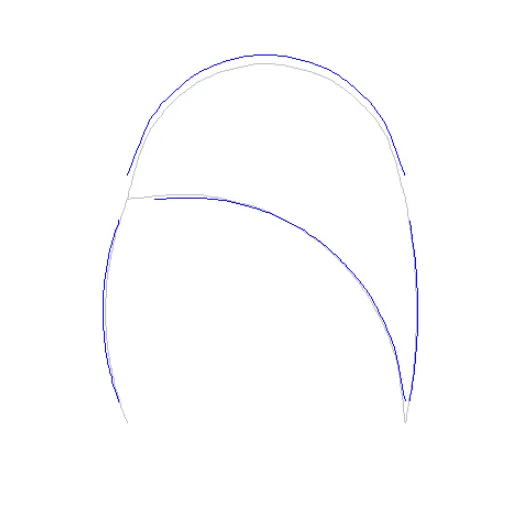
像这样,我可以剪切曲线的开头和结尾。但是我们可以看到,红色曲线与原始的黑色曲线不太匹配。
我如何改进我的offset和recalculate_points函数,以使红色曲线更好地适配黑色曲线?
或者更好的是:我在gg对象中可以在哪里找到曲线信息,以及如何使用该信息重新调整我的曲线?
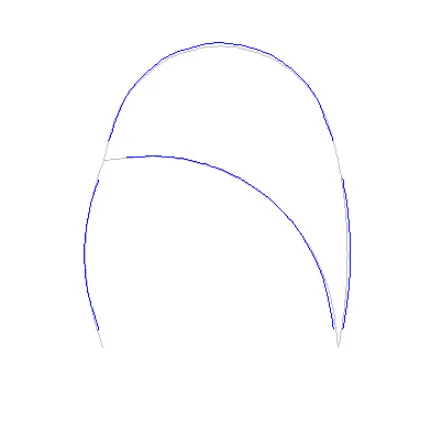
注意:我不需要100%的匹配。但是拟合应该在视觉上得到改善。因此,我的期望输出应该类似于:
geom_curve内部或者有一个更适合我的需求的geom选项,并发布了这个问题。由于似乎没有简单的解决方案,我将问题精炼为更具体的曲线切割部分。 - symbolrush... + geom_label(aes(x, y, label = curvature)),即在连接点的上方绘制。 - zx8754geom_label相比)。 - symbolrush