据我所知,
说明性示例
ggplot2通过geom_text绘制的标签的尺寸是已知的。否则,check_overlap选项将无法工作。
这些尺寸存储在哪里,我如何访问它们?
说明性示例
library(ggplot2)
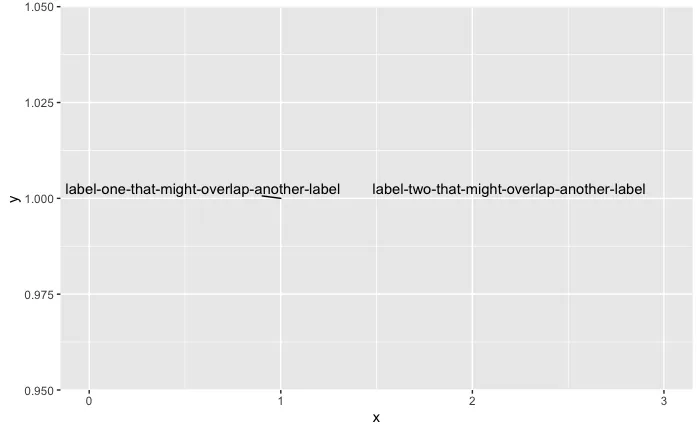
df <- data.frame(x = c(1, 2),
y = c(1, 1),
label = c("label-one-that-might-overlap-another-label",
"label-two-that-might-overlap-another-label"),
stringsAsFactors = FALSE)
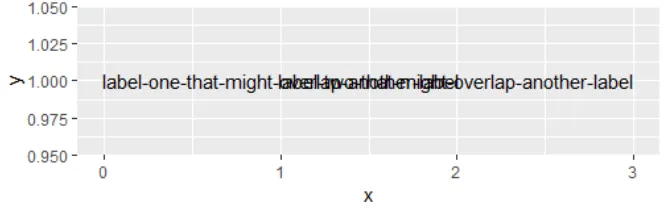
使用check_overlap = FALSE(默认值),标签会重叠。
ggplot(df, aes(x, y)) +
  geom_text(aes(label = label)) +
  xlim(0, 3)
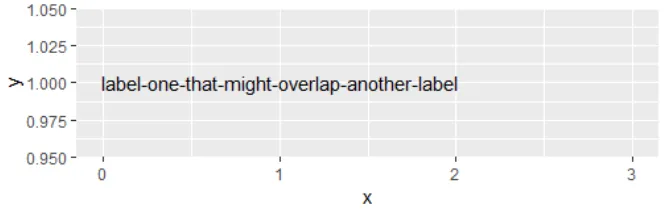
check_overlap = TRUE,第二个标签不会被绘制,因为ggplot发现了重叠。ggplot(df, aes(x, y)) +
geom_text(aes(label = label), check_overlap = TRUE) +
xlim(0, 3)
ggplot2 如何知道这些标签重叠?我如何访问该信息?
geom_text的底层代码在此和先前在该软件包的GH上的讨论在此,check_overlap参数被传递给grid::textGrob,因此我怀疑您无法在ggplot2中找到任何内容... - Z.Lingrob,并了解如何在当前的geom_text实现中通过它传递。 当我查看grid :: textGrob源代码时,我不理解它。 - symbolrush