我在使用ggplot2时,数据标签的顺序错误。
不幸的是,在这个话题上其他SE Q&A(example)的回答并不是很有见解,所以我需要提供一个可重现的示例。我有以下数据:
df = as.data.frame(structure(list(geotype = c('urban','urban','urban','urban','suburban','suburban','suburban','suburban'),
                              limitations = c('all','some','all','some','all','some','all','some'),
                              metric = c('lte','lte','5g','5g','lte','lte','5g','5g'),
                              capacity=c(12,11,5,4,14,10,5,3))))
如果我尝试使用以下代码绘制此数据:
ggplot(df, aes(x = geotype, y = capacity, fill=metric)) + geom_bar(stat="identity") +
 facet_grid(~limitations) +
 geom_text(data = df, aes(geotype, capacity + 2, label=capacity), size = 3)
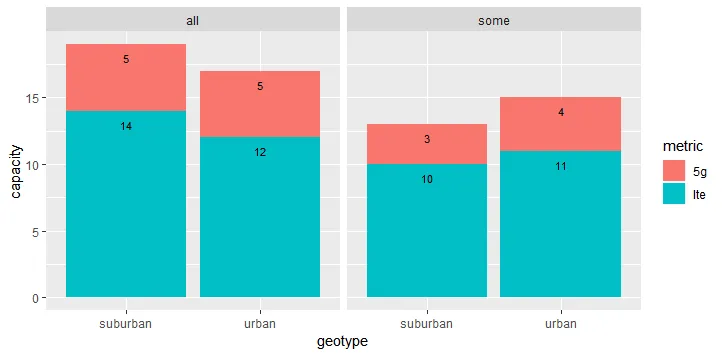
我得到了这个不正确的标签顺序:
我已经尝试了很久变量的排序(例如,rev(capacity)),但是我无法解决这个问题。有没有人能够为整个SE社区提供更全面的答案来处理标签的排序?