使用ggplot2将geom_text层左对齐

20

ggplot2 自动将文本居中在 geom_text 图层中。例如:

library(ggplot2)
library(tidyverse)
df <- data_frame(text = c("A short sentence.",
                      "A slightly longer sentence.",
                      "This sentence is the longest of the sentences."),
             y = row_number(text) - 1,
             x = 1)

ggplot(df, aes(x = x, y = y)) +
  geom_text(aes(label = text), nudge_x = nchar(text)/2)

生成:

ggplot:

到 ggplot 的链接(我还不能发布图片)

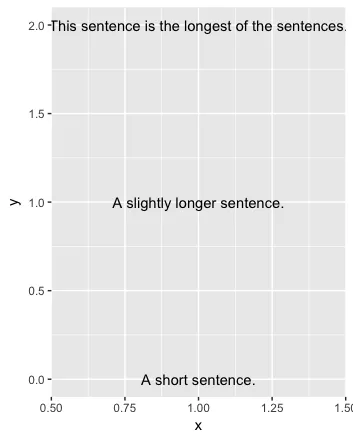
然而,我想将文本左对齐到一个整洁的列中。我基本上是在问如何为text提供xmin。我需要对x变量执行数学运算来相应地缩放x吗?还是有一个theme的技巧?


请参考以下链接:https://community.rstudio.com/t/how-do-i-set-an-xmin-argument-to-geom-text/785/3 - baptiste
1个回答

29
您可以使用 hjust
ggplot(df, aes(x = x, y = y)) +
  geom_text(aes(label = text), hjust = 0)

你也可以添加xlim来将列对齐到绘图的最左侧:

ggplot(df, aes(x = x, y = y)) +
  geom_text(aes(label = text), hjust = 0)  + xlim(1, 1.5)

在此输入图片描述


网页内容由stack overflow 提供, 点击上面的
可以查看英文原文,
原文链接