使用网格将多个ggplot2图表对齐

14

背景

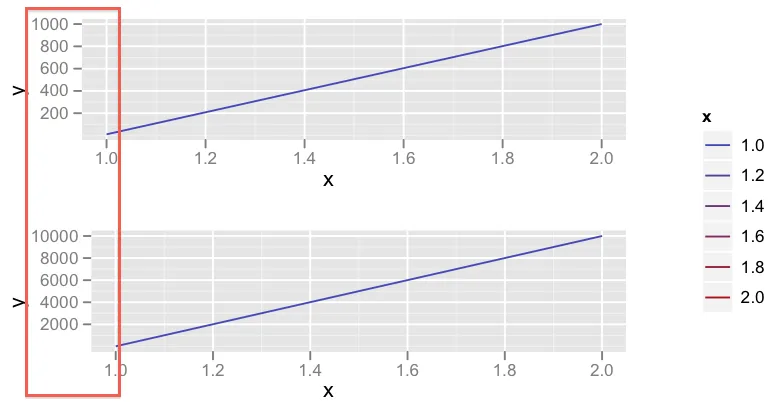
我想在同一页上绘制两个具有相同图例的ggplot2。 http://code.google.com/p/gridextra/wiki/arrangeGrob 中提到了如何做到这一点。这看起来已经很好了。但是...... 在我的示例中,我有两个具有相同x轴和不同y轴的绘图。当y轴的范围至少比另一个绘图高10倍时(例如10000而不是1000),ggplot2(或grid?)无法正确对齐绘图(请参见下面的输出)。

问题

如何使用两个不同的y轴也对齐绘图的左侧?

示例代码

x = c(1, 2)
y = c(10, 1000)
data1 = data.frame(x,y)
p1 <- ggplot(data1) + aes(x=x, y=y, colour=x) + geom_line()

y = c(10, 10000)
data2 = data.frame(x,y)
p2 <- ggplot(data2) + aes(x=x, y=y, colour=x) + geom_line()


# Source: http://code.google.com/p/gridextra/wiki/arrangeGrob
leg <- ggplotGrob(p1 + opts(keep="legend_box"))
legend=gTree(children=gList(leg), cl="legendGrob")
widthDetails.legendGrob <- function(x) unit(3, "cm")
grid.arrange(
  p1 + opts(legend.position="none"),
  p2 + opts(legend.position="none"),
  legend=legend, main ="", left = "")

输出

示例图片


1
请查看:https://dev59.com/ImYr5IYBdhLWcg3w6eQ3#13295880? - Etienne Low-Décarie
3个回答

10

以更通用的方式完成相同的操作的一种更清晰的方法是使用格式化程序参数:

p1 <- ggplot(data1) +
    aes(x=x, y=y, colour=x) +
    geom_line() + 
    scale_y_continuous(formatter = function(x) format(x, width = 5))

对于第二张图做同样的操作,并确保将宽度设置为大于两张图中最宽数字的预期宽度。


5
在我的 ggplot2 版本中,所使用的参数是“labels”,而不是“formatter”。 - simlmx

8

1. 使用cowplot包:

library(cowplot)
plot_grid(p1, p2, ncol=1, align="v")

enter image description here


2. 使用 ggbio 包中的 tracks

注意: 存在一个 bug,x 轴刻度不对齐。(测试于 2016 年 3 月 17 日,ggbio_1.18.5 版本)

library(ggbio)
tracks(data1=p1,data2=p2)

enter image description here


7

如果您不介意使用一个无耻的技巧,只需在 p1 中最长的标签上添加一个额外的字符,就像这样:

p1 <- ggplot(data1) +
    aes(x=x, y=y, colour=x) +
    geom_line() + 
    scale_y_continuous(breaks = seq(200, 1000, 200),
                       labels = c(seq(200, 800, 200), " 1000"))

我有两个基本的问题,如果你有你的原因,请原谅:

1)为什么不在两个轴上使用相同的y轴?我觉得这是一个更直接的方法,在你上面的例子中通过添加 scale_y_continuous(limits = c(0, 10000))p1 中可以轻松实现。

2)facet_wrap 提供的功能是否不足够?很难知道您的数据结构实际上是什么样子的,但这里有一个玩具示例,展示了我如何处理此问题:

library(ggplot2)

# Maybe your dataset is like this
x <- data.frame(x = c(1, 2),
                y1 = c(0, 1000),
                y2 = c(0, 10000))

# Molten data makes a lot of things easier in ggplot
x.melt <- melt(x, id.var = "x", measure.var = c("y1", "y2"))

# Plot it - one page, two facets, identical axes (though you could change them),
# one legend
ggplot(x.melt, aes(x = x, y = value, color = x)) +
    geom_line() +
    facet_wrap( ~ variable, nrow = 2)

3
赞同使用分面图来展示所举例的数据更为合适。如果提问者坚持希望y轴刻度独立,则可以添加scales = "free_y"选项。 - joran
谢谢@joran - 我记不得怎么做了。 - Matt Parker
2
将空格添加到标签中仅适用于are的输出。一旦我通过tikzdevice运行它,空格就被忽略了。 - apepper
2
我最终使用了分面技术。感谢您的建议。 - apepper

网页内容由stack overflow 提供, 点击上面的
可以查看英文原文,
原文链接