根据评论中的说明,我猜测您可能需要以下内容:
import numpy as np
import matplotlib.pyplot as plt
def plot_exponential_density(mu, xmax, fmt, label):
x = np.arange(0, xmax, 0.1)
y = 1/mu * np.exp(-x/mu)
plt.plot(x, y, fmt, label=label)
def sample_and_plot(N, color):
samples = np.zeros( (N,1) )
for i in range(0,N):
samples[i] = np.random.exponential()
mu = np.mean(samples)
print("N = %d ==> mu = %f" % (N, mu))
(n, bins) = np.histogram(samples, bins=int(np.sqrt(N)), density=True)
plt.step(bins[:-1], n, color=color, label="samples N = %d" % N)
xmax = max(bins)
plot_exponential_density(mu, xmax, color + "--", label="estimated density N = %d" % N)
return xmax
xmax1 = sample_and_plot(100, 'r')
xmax2 = sample_and_plot(10000, 'b')
plot_exponential_density(1, max(xmax1, xmax2), 'k', "true density")
plt.legend()
plt.show()
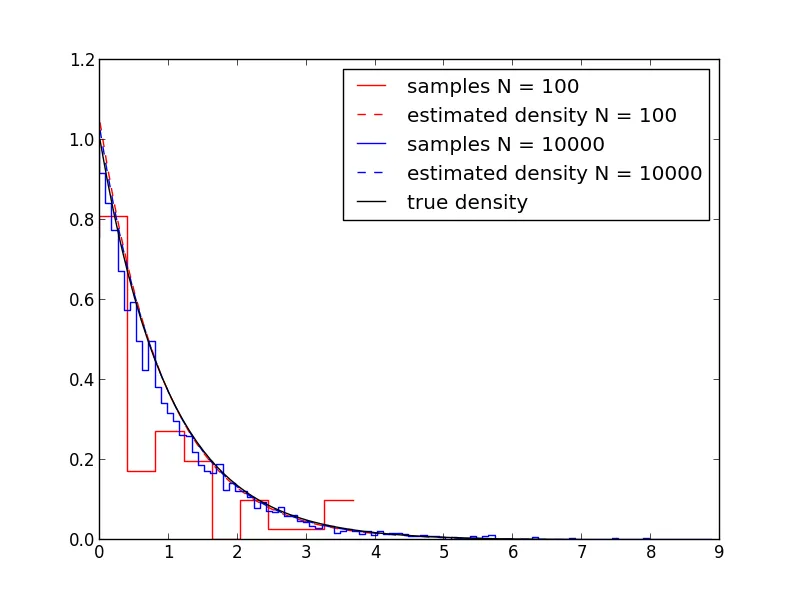
我用了100和10,000个样本,因为在1,000个样本时,估计已经相当不错。但即使只有100个样本,我也有些惊讶平均数的估计结果和密度的估计结果是多么好。如果没有知道这些样本来自指数分布,仅凭直方图,我不确定我是否会认出指数分布...