我试图重现实际参数和估计参数之间的均方误差'tau' (已经尝试了一个月:()。估计的'tau',即 'tau_hat'是通过最大似然估计(MLE)获得的,如下所示。
联合概率密度函数f(y|x,tau)的表达式为
其中u_i = x_i + T,T~IG(mu,lambda)。IG:逆高斯分布。 u是y的期望值。
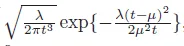
f_T(t)的概率密度函数如下:
clear
lambda = 8.1955;
mu = 10;
N = 128; % max number of molecules
x = zeros(N,1); % transmission time of the molecules from the Tx; for K = 1
tau = .5; % arbitrary initital tau
simN = 1000 ; % # runs per N
no_molecules_per_simN = [4, 8, 32, 64, N];
tau_hat = zeros(size(no_molecules_per_simN));
for ii=1: length(no_molecules_per_simN)
Lkeh = zeros(1,length(no_molecules_per_simN(ii))); % inititalize likelihood array
for jj=1: simN
T = random('InverseGaussian', mu,lambda, [no_molecules_per_simN(ii),1]); % random delay
y_prime = x(1:no_molecules_per_simN(ii)) + T + tau; % arrival time of the molecules seen by the Rx
y_prime_sort = sort(y_prime); % to arrange them in the ascending order of arrival
u = y_prime_sort; % assign to u variable
t = u - x(1:no_molecules_per_simN(ii)) - tau;
for kk = 1: length(u)
% applying the likelihood function to eq. 3 and ignoring the constant terms
%linear likelihood
% Lkeh(jj,kk) = prod(t(kk).^-1.5).*exp(-sum((t(kk) - mean(t)).^2./t(kk)).*(lambda./(2.*mean(t).^2 )));
% [UPDATE to the code]
% log likelihood
Lkeh(jj,kk) = -1.5*sum(t(kk))-(lambda./(2.*mu.^2 )).*sum((t(kk) - mu).^2./t(kk));
end
end
Lkeh_mean = mean(Lkeh,1); % averging the values
% [UPDATE to the code]
[maxL,index] = max(Lkeh_mean);
t_hat(ii) = T(index) ; % this will give the likelihood value of the propagation delay
tau_hat(ii) = mean(u - x(1:no_molecules_per_simN(ii)) - t_hat(ii)); % reverse substitution
end
MSE = zeros(size(tau_hat)); % initializing the array for MSE
for ii=1:length(tau_hat)
MSE(ii) = immse(tau,tau_hat(ii)); % mean squared error
end
figure
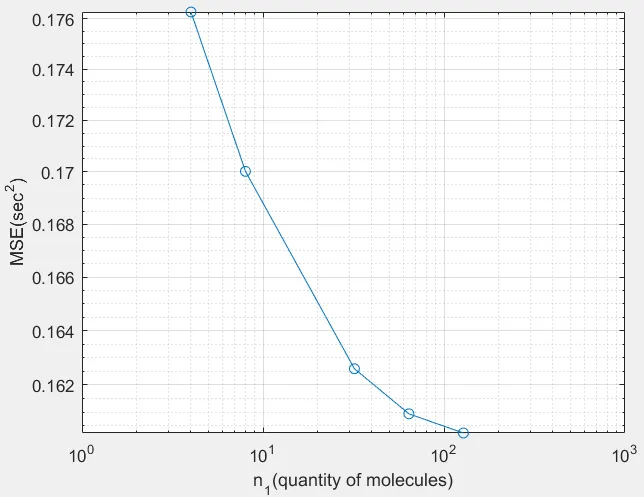
loglog(no_molecules_per_simN,MSE,'-o')
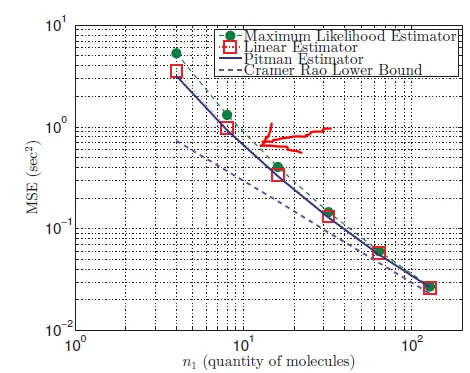
xlabel('n_{1}(quantity of molecules)')
ylabel('MSE(sec^{2})')
grid on
我获得的结果是{{}}。
 。在我的代码中犯了什么错误?我不太确定如何计算
argmax。供您参考,我所参考的科学论文在这里。
- u是y_prime_sort,已经排序过了。我不确定为什么需要排序,但是假设你想要使用排序后的向量进行操作,那么你需要对所有向量应用相同的排序,否则这会影响你的结论。同样,你可能想要使用逻辑索引;[y_prime_sort,sortingOrderIdx] = sort(y_prime); 然后请将sortingOrderIdx应用到你在计算中使用的其他向量上。
- pacta_sunt_servanda- 我也使用了对数似然函数。[代码也将进行更新]
- 'u' 被排序以按照它们到达的时间顺序排列分子。
- nashynash