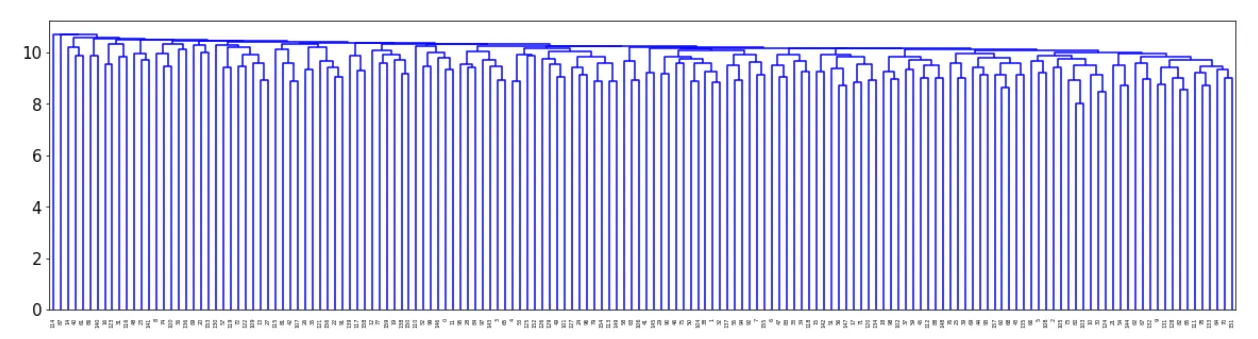
我在pandas中有一个大小为(106x106)的大型相关系数矩阵,具有以下结构:
+---+-------------------+------------------+------------------+------------------+------------------+-----------------+------------------+------------------+------------------+-------------------+
|   |         0         |        1         |        2         |        3         |        4         |        5        |        6         |        7         |        8         |         9         |
+---+-------------------+------------------+------------------+------------------+------------------+-----------------+------------------+------------------+------------------+-------------------+
| 0 |               1.0 |   0.465539925807 |   0.736955649673 |   0.733077703346 |  -0.177380436347 | -0.268022641963 |  0.0642473239514 | -0.0136866435594 |  -0.025596700815 | -0.00385065532308 |
| 1 |    0.465539925807 |              1.0 |  -0.173472213691 |   -0.16898620433 | -0.0460674481563 | 0.0994673318696 |   0.137137216943 |   0.061999118034 |  0.0944808695878 |   0.0229095105328 |
| 2 |    0.736955649673 |  -0.173472213691 |              1.0 |   0.996627003263 |  -0.172683935315 |  -0.33319698831 | -0.0562591684255 | -0.0306820050477 | -0.0657065745626 |  -0.0457836647012 |
| 3 |    0.733077703346 |   -0.16898620433 |   0.996627003263 |              1.0 |  -0.153606414649 | -0.321562257834 | -0.0465540370732 | -0.0224318843281 | -0.0586629098513 |  -0.0417237678539 |
| 4 |   -0.177380436347 | -0.0460674481563 |  -0.172683935315 |  -0.153606414649 |              1.0 | 0.0148395123941 |   0.191615549534 |   0.289211355855 |    0.28799868259 |    0.291523969899 |
| 5 |   -0.268022641963 |  0.0994673318696 |   -0.33319698831 |  -0.321562257834 |  0.0148395123941 |             1.0 |   0.205432455075 |   0.445668299971 |   0.454982398693 |    0.427323555674 |
| 6 |   0.0642473239514 |   0.137137216943 | -0.0562591684255 | -0.0465540370732 |   0.191615549534 |  0.205432455075 |              1.0 |   0.674329392219 |   0.727261969241 |     0.67891326835 |
| 7 |  -0.0136866435594 |   0.061999118034 | -0.0306820050477 | -0.0224318843281 |   0.289211355855 |  0.445668299971 |   0.674329392219 |              1.0 |   0.980543049288 |    0.939548790275 |
| 8 |   -0.025596700815 |  0.0944808695878 | -0.0657065745626 | -0.0586629098513 |    0.28799868259 |  0.454982398693 |   0.727261969241 |   0.980543049288 |              1.0 |    0.930281915882 |
| 9 | -0.00385065532308 |  0.0229095105328 | -0.0457836647012 | -0.0417237678539 |   0.291523969899 |  0.427323555674 |    0.67891326835 |   0.939548790275 |   0.930281915882 |               1.0 |
+---+-------------------+------------------+------------------+------------------+------------------+-----------------+------------------+------------------+------------------+-------------------+
为了简便起见,此处截断。
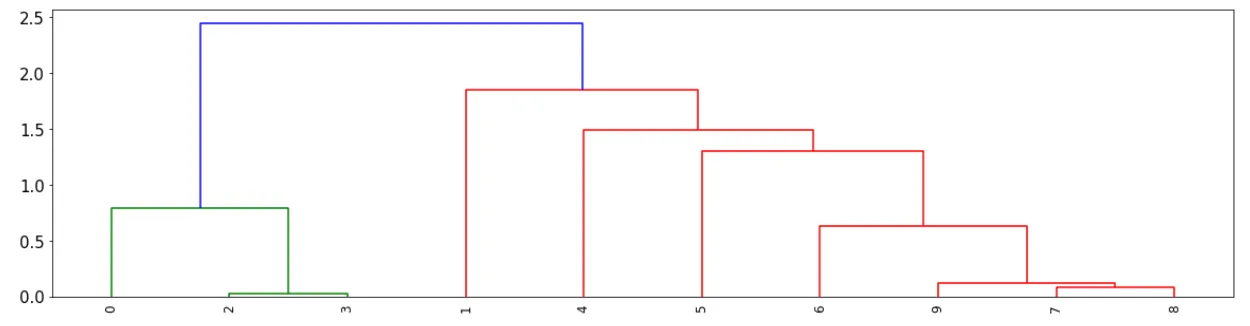
如果我计算关联性并使用以下代码绘制树状图:
from scipy.cluster.hierarchy import dendrogram, linkage
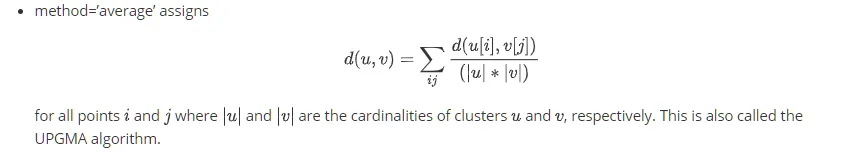
Z = linkage(result_df.corr(),'average')
plt.figure()
fig, axes = plt.subplots(1, 1, figsize=(20, 20))
axes.tick_params(axis='both', which='major', labelsize=15)
dendrogram(Z=Z, labels=result_df_null_cols.columns,
leaf_rotation=90., ax=axes,
color_threshold=2.)
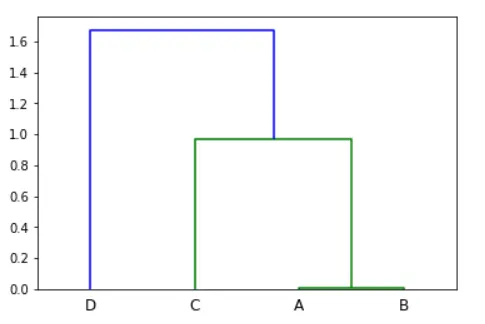
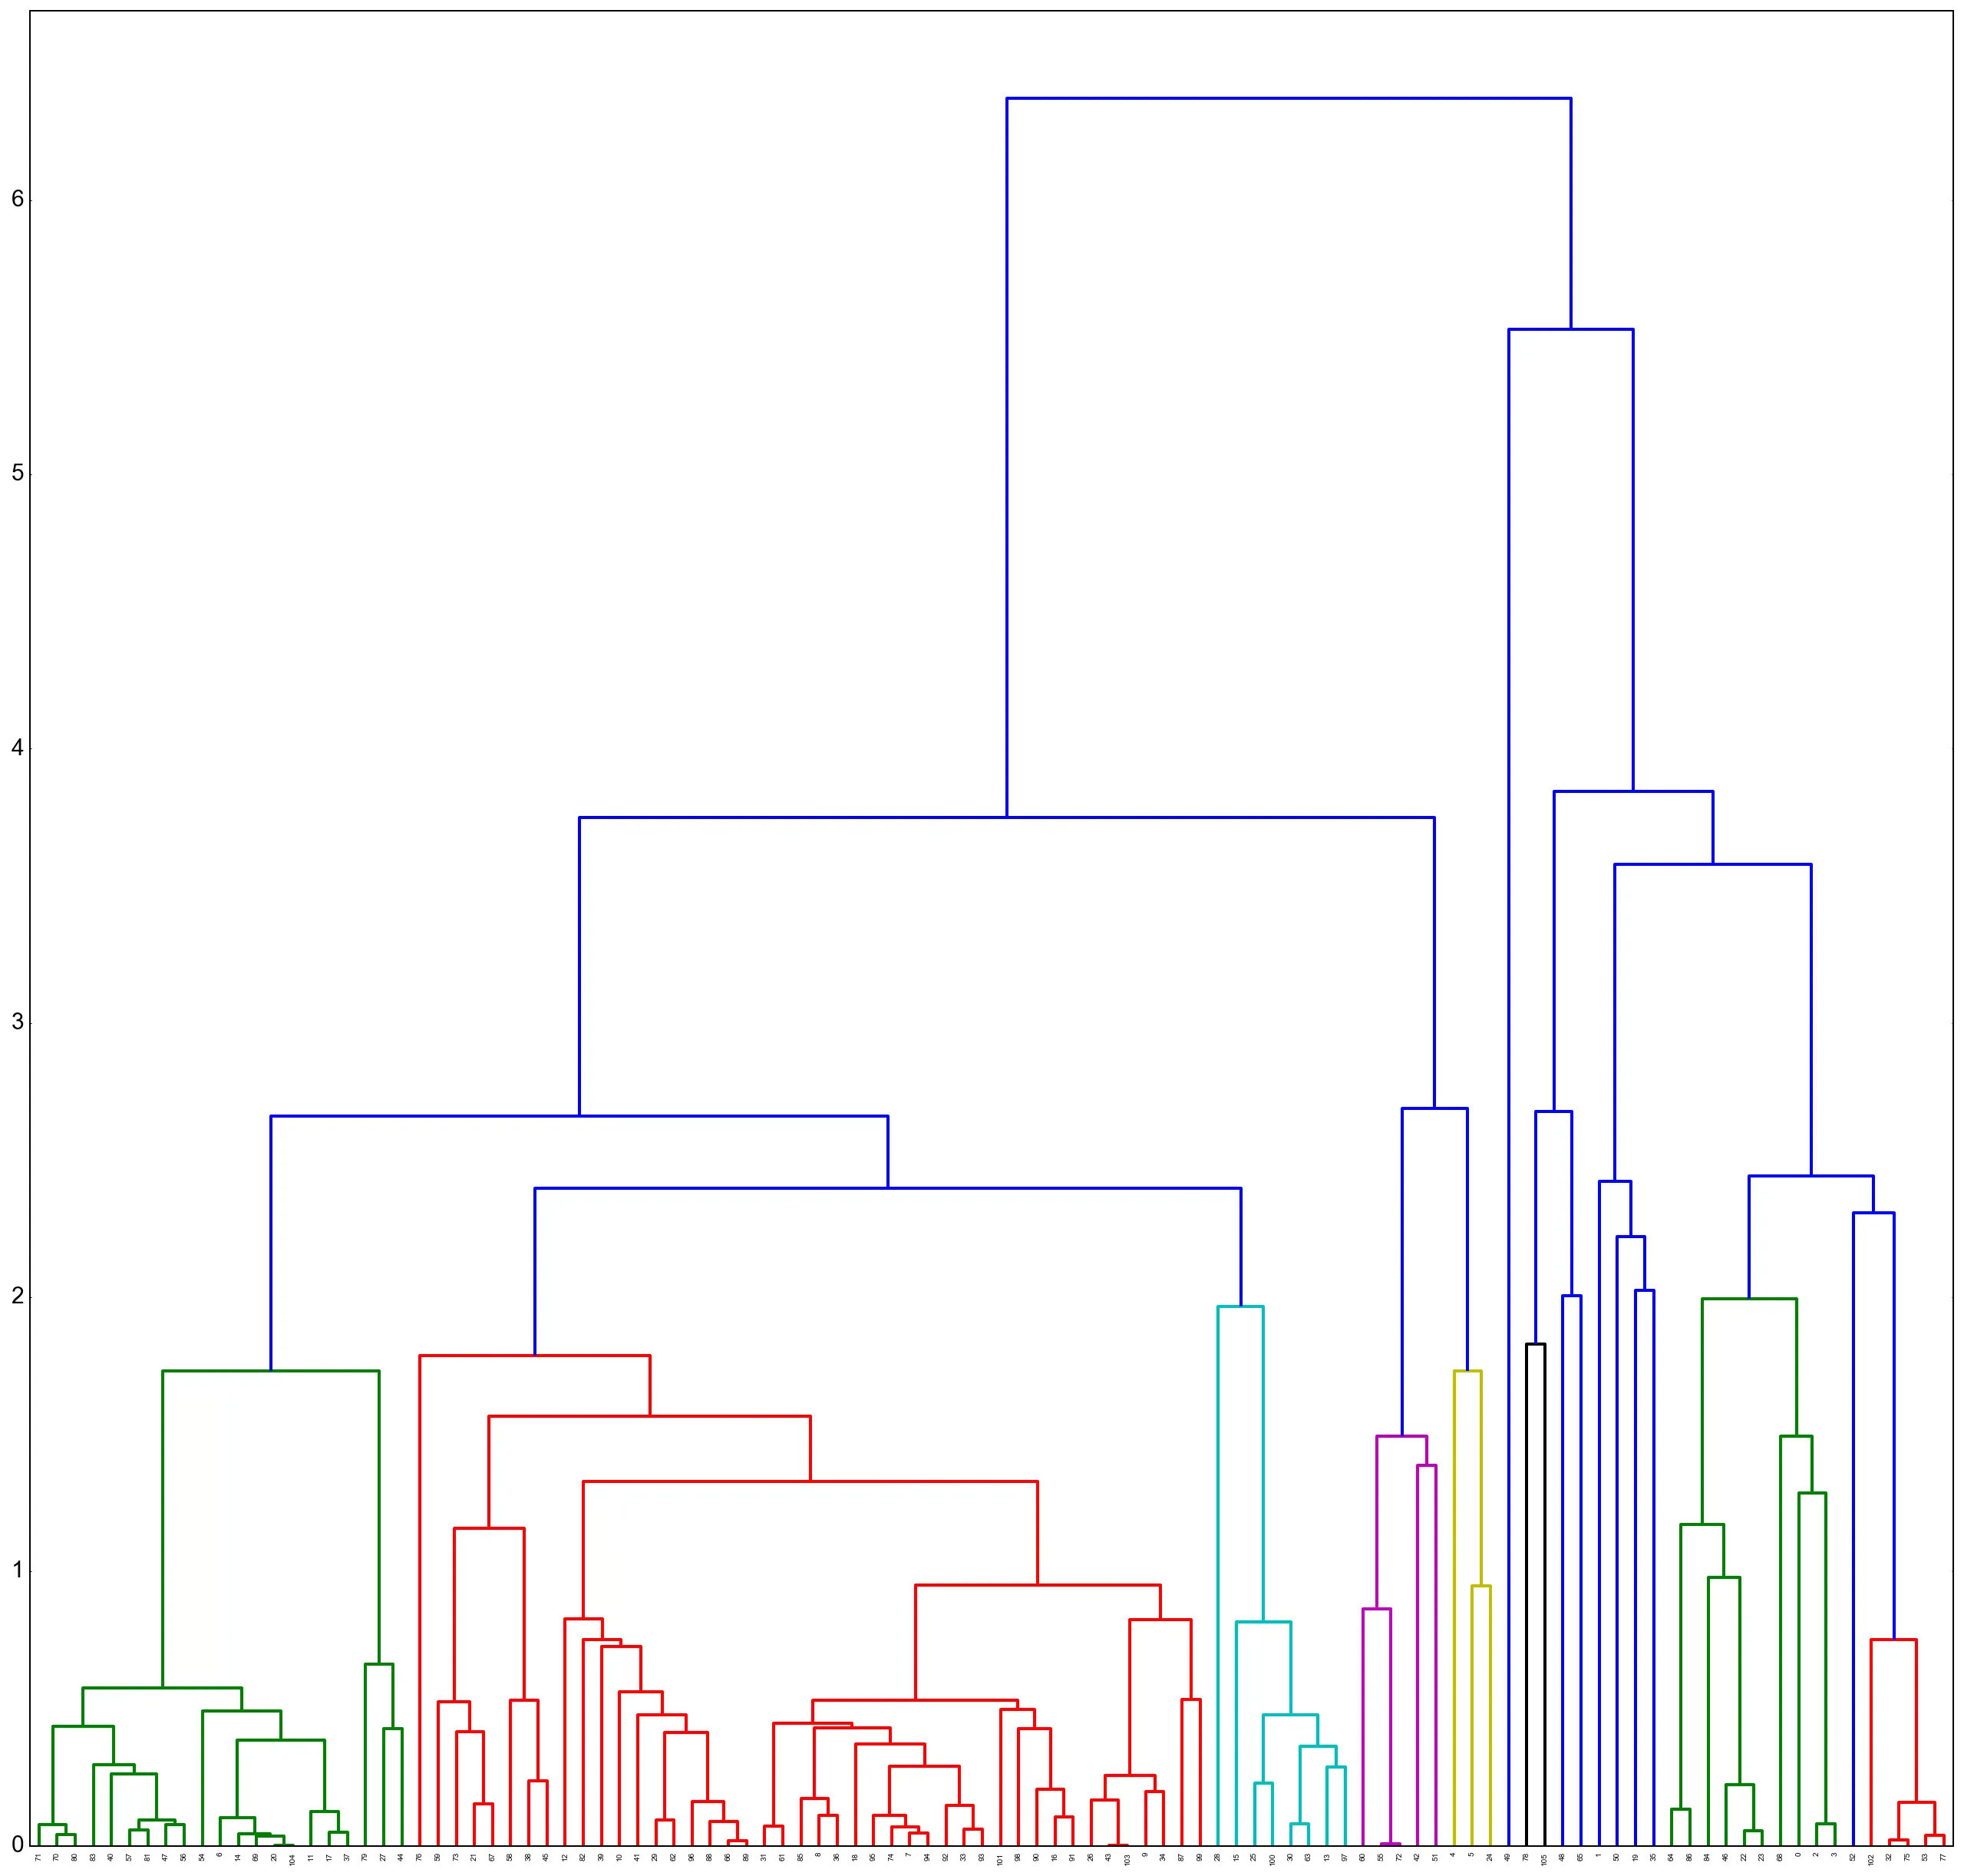 我的问题涉及y轴。在我看到的所有示例中,Y轴被限制在0和2之间 - 我已经理解它表示为
(1-corr)。在我的结果中,边界要高得多。0代表高度相关的项目(1-1=0),而2则是低度相关内容的截止点(1--1=2)。我找到了以下答案,但它与这个答案不一致,以及参考讲义在这里。
无论如何 - 希望有人可以澄清哪个来源是正确的,并帮助传播一些关于此主题的知识。