在pyplot中,两个子图共享一个y轴标签

9

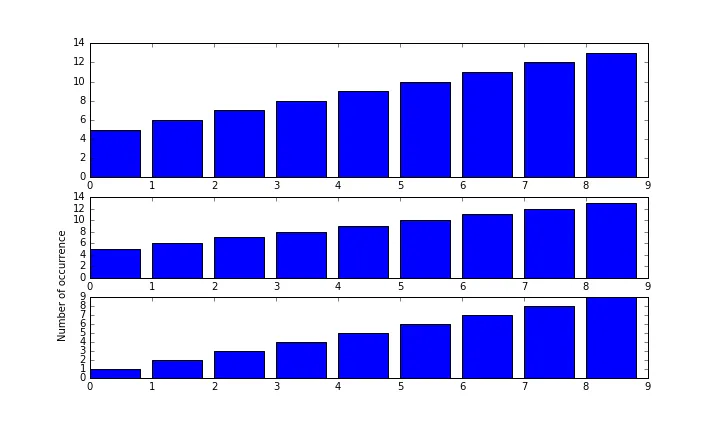
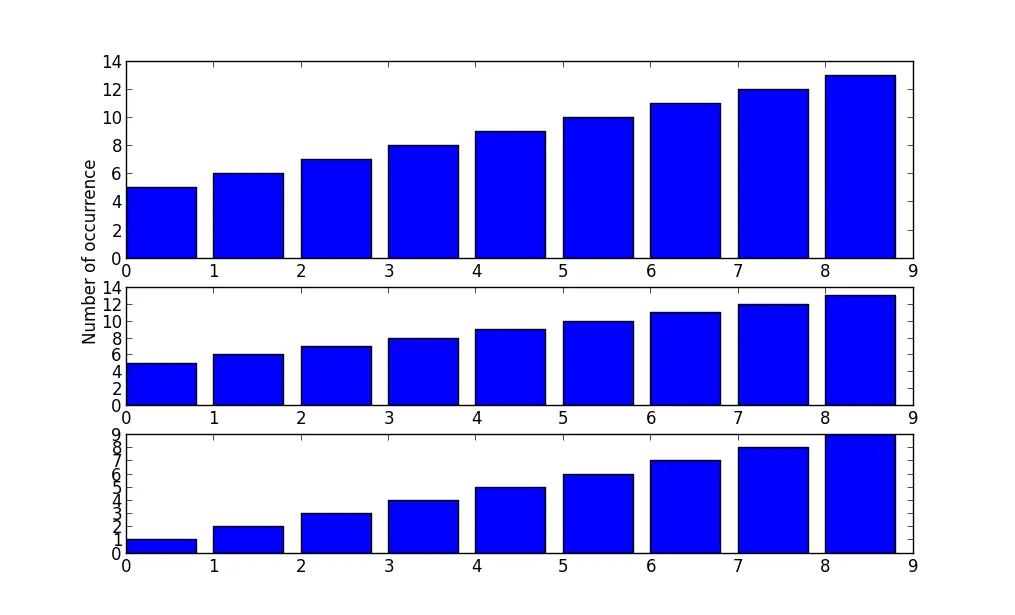
我有下面的代码,它生成了如下所示的图表。

mport matplotlib.pyplot as plt 
import matplotlib.gridspec as gridspec
import numpy as np

One = range(1,10)
Two = range(5, 14) 
l = len(One)
fig = plt.figure(figsize=(10,6))
gs = gridspec.GridSpec(3, 1, height_ratios=[5, 3, 3]) 

ax0 = plt.subplot(gs[0])
ax0.bar(range(l), Two)
plt.ylabel("Number of occurrence")

ax1 = plt.subplot(gs[1], sharey=ax0)
ax1.bar(range(l), Two)

ax2 =  plt.subplot(gs[2])
ax2.bar(range(l), One)

plt.show()

我希望纵轴标签(“发生次数”)在第一张图和第二张图之间共享,也就是说,它应该出现在第一张和第二张图的中心左侧。 我该怎么做?


您的意思是“出现次数”吗? - kd88
4个回答

4
我能想到的最好方法是将文本添加到图像本身,并将其定位在中心位置(图像坐标为0.5),如下所示。
import matplotlib.pyplot as plt
import matplotlib.gridspec as gridspec
import numpy as np

One = range(1,10)
Two = range(5, 14)
l = len(One)
fig = plt.figure(figsize=(10,6))
gs = gridspec.GridSpec(3, 1, height_ratios=[5, 3, 3])

ax0 = plt.subplot(gs[0])
ax0.bar(range(l), Two)

ax1 = plt.subplot(gs[1], sharey=ax0)
ax1.bar(range(l), Two)

ax2 =  plt.subplot(gs[2])
ax2.bar(range(l), One)

fig.text(0.075, 0.5, "Number of occurrence", rotation="vertical", va="center")

plt.show()

1
你还可以使用ylabely参数手动调整位置:
import matplotlib.pyplot as plt 
import matplotlib.gridspec as gridspec
import numpy as np

One = range(1,10)
Two = range(5, 14) 
l = len(One)
fig = plt.figure(figsize=(10,6))
gs = gridspec.GridSpec(3, 1, height_ratios=[5, 3, 3]) 

ax0 = plt.subplot(gs[0])
ax0.bar(range(l), Two)
plt.ylabel("Number of occurrence", y=-0.8)          ##  ← ← ← HERE

ax1 = plt.subplot(gs[1], sharey=ax0)
ax1.bar(range(l), Two)

ax2 =  plt.subplot(gs[2])
ax2.bar(range(l), One)

plt.show()

enter image description here


0

不是非常复杂的解决方案,但这样可以吗?替换

plt.ylabel("Number of occurrence")

使用

plt.ylabel("Number of occurrence", verticalalignment = 'top')

[编辑]

对于我的64位Python版本(2.7.3),我需要进行一些小的更改。

plt.ylabel("Number of occurrence", horizontalalignment = 'right')

根据我的理解,它看起来是这样的,这不是你想要的吗?

enter image description here


这不会将标签放在前两个图的中心。 - DurgaDatta
@DurgaDatta 我已经添加了图片在我的电脑上的样子,这符合要求吗? - Brad
这可以完成我的工作。但是,我在我的机器上没有得到这种类型的图像。你把那行放在哪里?这会有影响吗? - DurgaDatta
只需将您的 ylabel 替换为我上面提供的那个即可。 - Brad
我在Python 2.7.3 32位上尝试了它,它可以正常工作,但是当我在2.7.3 64位上尝试时,它就无法正常工作。如果您正在使用64位,则请尝试使用plt.ylabel("Number of occurrence", horizontalalignment='right') - Brad

0

我认为这个问题更多的是在正确术语下创建多轴。我想指向我提出的问题和我收到的答案,这将为您提供创建绘图的多轴解决方案。

Matplotlib中类似问题的解决方案链接: 使用多个轴

其他相关问题的链接是:具有不同比例尺度的matplotlib多轴


网页内容由stack overflow 提供, 点击上面的
可以查看英文原文,
原文链接