这与之前的问题 new pythonic style for shared axes square subplots in matplotlib? 有关(或者说是其后续)。
我想要像上面链接中提到的那样,让子图共享一个轴。不过,我还想让各个子图之间没有空白。以下是代码的相关部分:
f, (ax1, ax2) = plt.subplots(1, 2, sharex=True, sharey=True)
plt.setp(ax1, aspect=1.0, adjustable='box-forced')
plt.setp(ax2, aspect=1.0, adjustable='box-forced')

# Plot 1
ax1.matshow(pixels1, interpolation="bicubic", cmap="jet")
ax1.set_xlim((0,500))
ax1.set_ylim((0,500))

# Plot 2
ax2.matshow(pixels2, interpolation="bicubic", cmap="jet")
ax2.set_xlim((0,500))
ax2.set_ylim((0,500))

f.subplots_adjust(wspace=0)
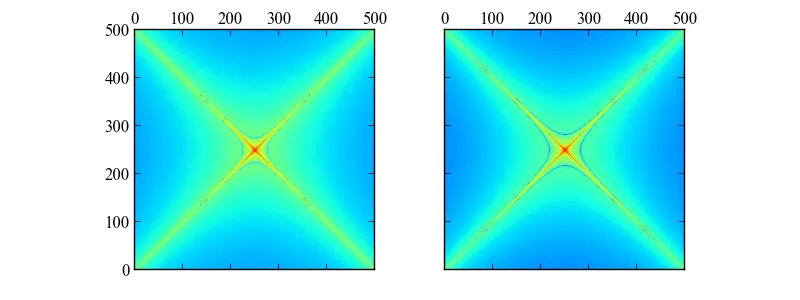
这是结果:
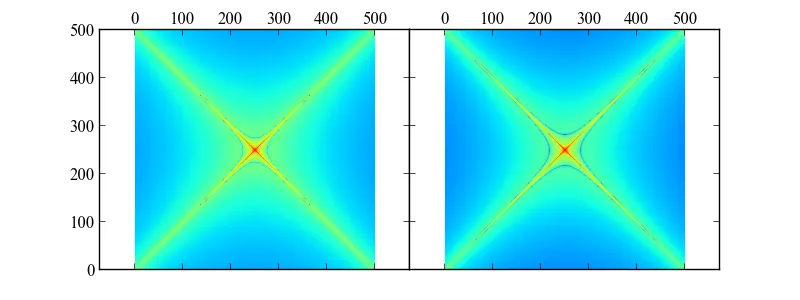
如果我注释掉两个plt.setp()命令,就会出现一些额外的白色边框:
如何使图像看起来像我的第一个结果,但轴与第二个结果一样接触?
subplots_adjust隐藏了轴,这可能不是所需的。我建议使用subplots_adjust(hspace=0),它可以专门删除面板之间的空间。 - Benjamin Banniersubplots_adjust(wspace=0),但它并没有减少空间。然而,您的解决方案使用适当的图形大小并仔细调整子图边距对称地有效,对于我的目的已经足够了!然而,我仍然感到困惑的是,我的原始代码为什么不起作用... - Michael Becker