Seaborn图形化显示“displot”函数如何使用色调和双y轴比例尺(twinx)。

3
我正在尝试绘制机器学习模型预测的输出,目标变量有1和0两个类别,还有得分。由于数据集不平衡,1的数量很少。
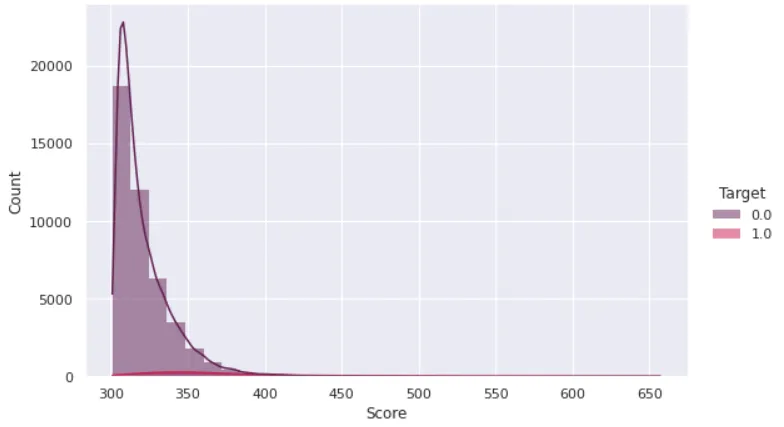
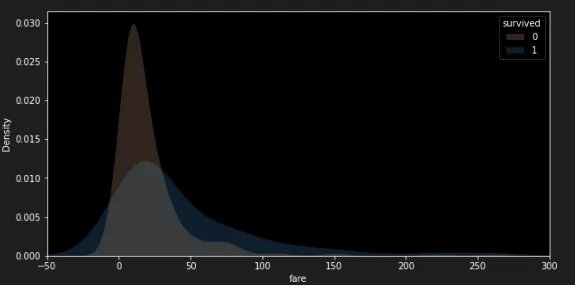
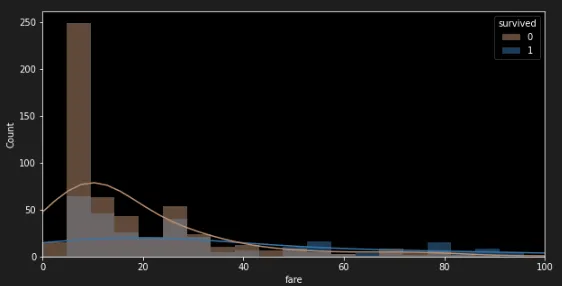
当我使用hue参数将Target绘制在简单的displot中时,该图对描述1无用。
sns.set_theme()
sns.set_palette(sns.color_palette('rocket', 3))
sns.displot(df, x='Score', hue='Target', bins=30, linewidth=0, height=5, kde=True, aspect=1.6)
plt.show()

enter image description here

我希望在同一张图中更改1的比例尺,使用twinx在右侧添加第二个y比例尺。
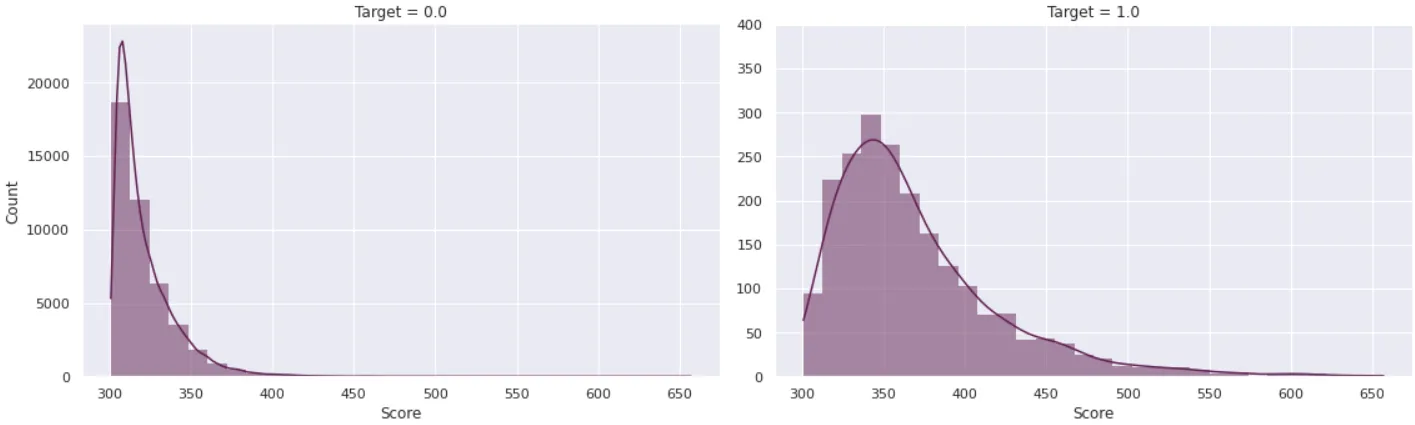
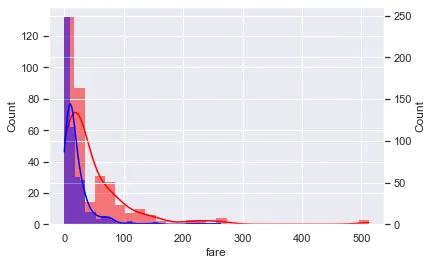
我尝试了以下代码,可以在两个图中解决问题,但是我只需要一个图。我无法使用twinx。
g = sns.displot(df, x='Score', col='Target', bins=30, linewidth=0, height=5, kde=True, aspect=1.6, facet_kws={'sharey': False, 'sharex': False})
g.axes[0,1].set_ylim(0,400)
plt.show()

enter image description here

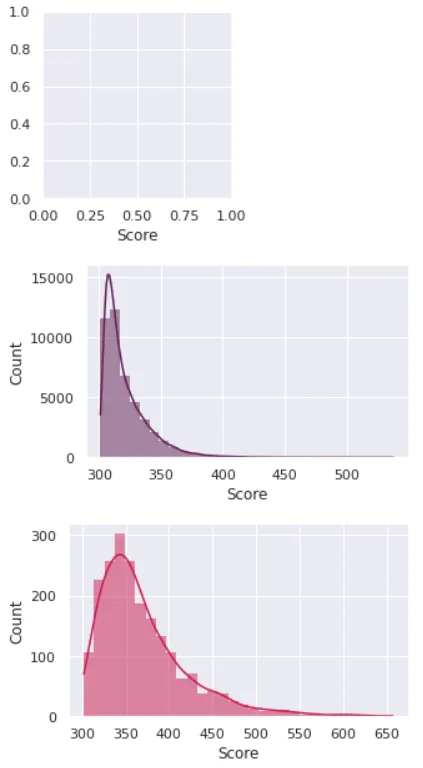
g = sns.FacetGrid(df, hue='Target')
g = g.map(sns.displot, 'Score', bins=30, linewidth=0, height=3, kde=True, aspect=1.6)

enter image description here

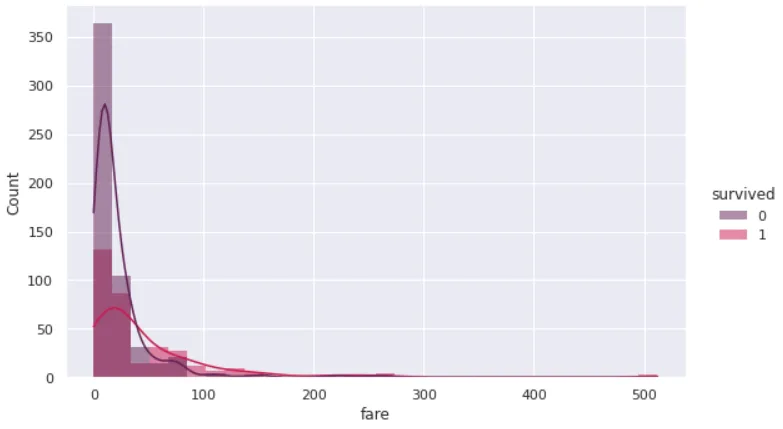
一个可重现的例子可以使用泰坦尼克号数据集:

df_ = sns.load_dataset('titanic')
sns.displot(df_, x='fare', hue='survived', bins=30, linewidth=0, height=5, kde=True, aspect=1.6)

enter image description here

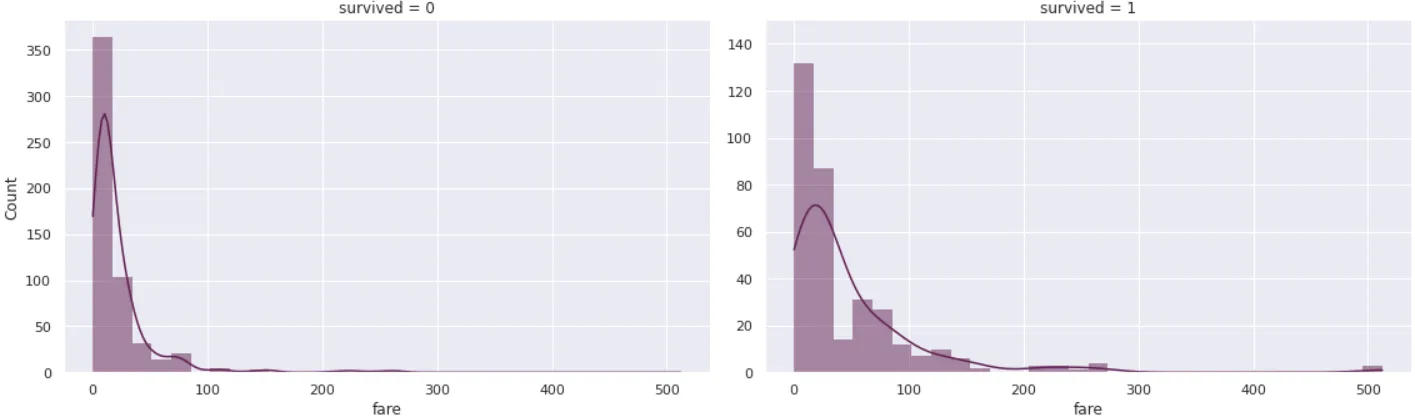
g = sns.displot(df_, x='fare', col='survived', bins=30, linewidth=0, height=5, kde=True, aspect=1.6, facet_kws={'sharey': False, 'sharex': False})
g.axes[0,1].set_ylim(0,150)
plt.show()

enter image description here


你有考虑过使用 displot 和相关函数的 common_norm=False 选项吗? - JohanC
1
我认为seaborn histplot和displot的输出不匹配是相关的,但并不是重复的。 - Trenton McKinney
3个回答

5

为了比较具有不同数量观测值的分布形状,您可以通过设置stat="density"来对它们进行归一化处理。默认情况下,这将使用相同的分母对每个分布进行归一化,但是您可以通过设置common_norm=False来独立归一化每个分布:

sns.displot(
    titanic, x='fare', hue='survived',
    bins=30, linewidth=0, kde=True,
    stat="density", common_norm=False,
    height=5, aspect=1.6
)

enter image description here

两个分布的峰值不在同一y值上,但这是数据的真实特征:幸存者人群的票价范围更广,且低端聚集程度较低。如果使用两个独立的y轴并将它们缩放以使每个分布的峰值高度相等,那么会产生误导。


1
谢谢!我刚开始使用sns,你的解决方案很有道理,虽然不是我最初寻找的,但这是更好的方法。 - Napoleón Cortés

2
我不确定,但你是在寻找这个吗?
import seaborn as sns
import matplotlib.pyplot as plt
sns.set()
df_ = sns.load_dataset('titanic')
sns.histplot(df_[df_['survived']==1]['fare'], bins=30, linewidth=0, kde=True, color='red')
ax2 = plt.twinx()
sns.histplot(df_[df_['survived']==0]['fare'], bins=30, linewidth=0, kde=True, ax=ax2, color='blue')

Plot


这正是我想要的,非常感谢!我正在使用sns绘图,我不知道histplot可以解决问题。 - Napoleón Cortés
很高兴能够帮助。祝你有美好的一天。 - max12525k

0

Displot()不再具有statcommon_norm属性(这些属性在mwaskom的答案中提到),但可以使用kdeplot()histplot()函数获得类似的输出。

kdeplot()中,不需要statkde参数,因为该函数已经计算了密度估计:

sns.kdeplot(
data=titanic, x='fare', hue='survived',
linewidth=0,  common_norm=False, fill=True)
plt.xlim(-50,300)

kdeplot_img

histplot() 的替代方法。

sns.histplot(
data=titanic, x='fare', hue='survived',
linewidth=0,  common_norm=False, kde=True)
plt.xlim(0,100)

histplot_img

值得注意的是,kde参数在后台使用kdeplot(),可以通过kde_kws指定自己的kde属性。
文档:kdeplot, histplot

网页内容由stack overflow 提供, 点击上面的
可以查看英文原文,
原文链接