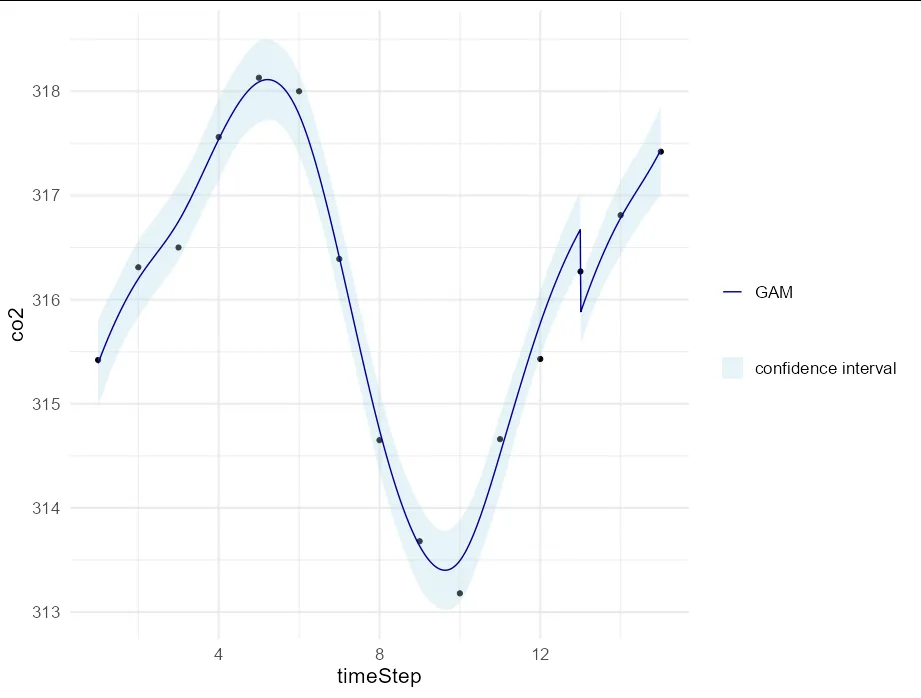
我已经创建了一个GAM模型,并设置了预测,但是在如何绘制模型的任何平滑函数方面遇到了困难。一直在尝试在ggplot中绘制这些函数,但现在添加了月份后,使用参数/美学方面有些困难。看到有些人建议也使用geom_smooth(),但我不确定。如果有人能就此向我提供建议,那将是很棒的。下面是我的数据、模型和预测:
模型
mod = gam(co2 ~ s(timeStep, k = 200, bs = "cs") + s(month, k = 12, bs = "cc"),
                data = carbonD,
                family = gaussian(link = "identity"))
预测
#create predictions
preds = predict(mod, type = 'terms', se.fit = TRUE)
#combine our predictions with coefficients
fit = preds$fit + coef(mod)[1]
数据片段
carbonD
       co2 month year timeStep
1   315.42     1 1959        1
2   316.31     2 1959        2
3   316.50     3 1959        3
4   317.56     4 1959        4
5   318.13     5 1959        5
6   318.00     6 1959        6
7   316.39     7 1959        7
8   314.65     8 1959        8
9   313.68     9 1959        9
10  313.18    10 1959       10
11  314.66    11 1959       11
12  315.43    12 1959       12
13  316.27     1 1960       13
14  316.81     2 1960       14
15  317.42     3 1960       15