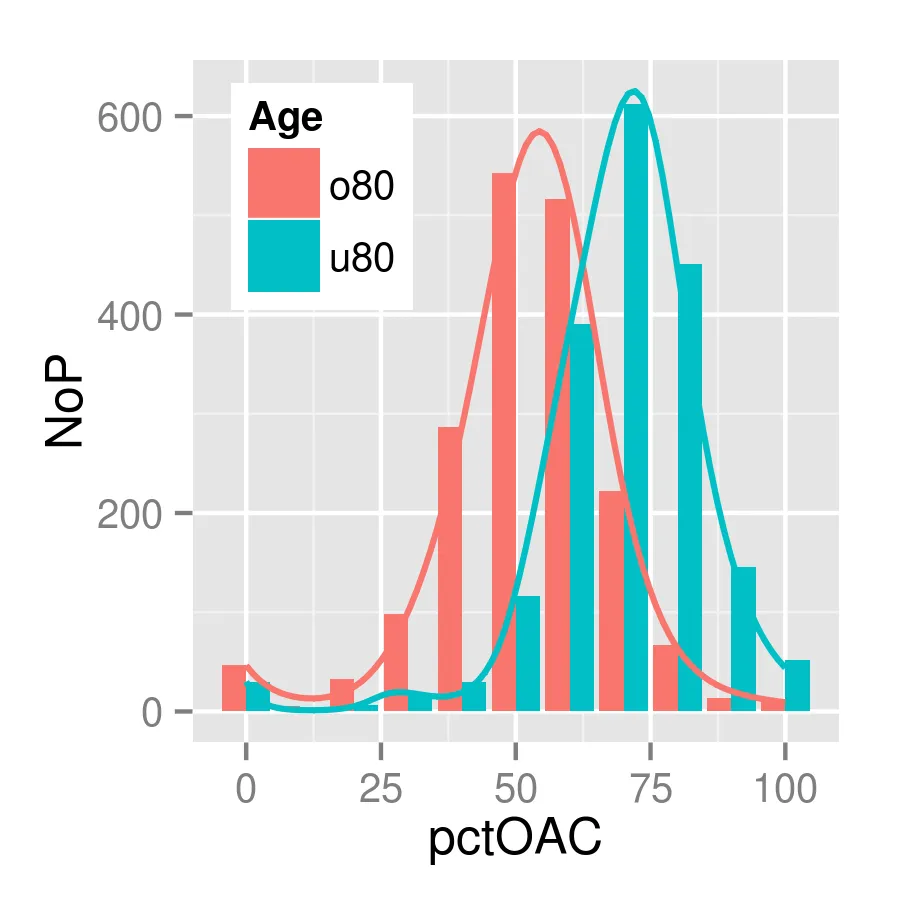
ggplot中的平滑处理

13
我有这个 ggplot。
ggplot(dt.1, aes(x=pctOAC,y=NoP, fill=Age)) +
    geom_bar(stat="identity",position=position_dodge()) +
    geom_smooth(aes(x=pctOAC,y=NoP, colour=Age), se=F, method="loess",show_guide = FALSE,lwd=0.7) +
    theme(legend.position=c(.2,0.8))

在此输入图片描述

dt1 <- structure(list(Age = structure(c(1L, 1L, 1L, 1L, 1L, 1L, 1L, 1L, 1L, 1L, 1L, 2L, 2L, 2L, 2L, 2L, 2L, 2L, 2L, 2L, 2L, 2L), .Label = c("o80", "u80"), class = "factor"), NoP = c(47L, 5L, 33L, 98L, 287L, 543L, 516L, 222L, 67L, 14L, 13L, 30L, 1L, 6L, 17L, 30L, 116L, 390L, 612L, 451L, 146L, 52L), pctOAC = c(0, 10, 20, 30, 40, 50, 60, 70, 80, 90, 100, 0, 10, 20, 30, 40, 50, 60, 70, 80, 90, 100)), .Names = c("Age", "NoP", "pctOAC"), row.names = c(NA, -22L), class = "data.frame")

我希望让平滑曲线保持在零线之上,可能类似于核密度。实际上,如果我拥有底层数据,我期望的是一个核密度,但我只有聚合数据。有没有办法做到这一点?我尝试在geom_smooth中使用不同的method=,但是小数据集似乎阻止了它。我想尝试使用stat_function,但我不知道如何找到适合绘图的函数。


难道没有geom_density吗? - IRTFM
2个回答

14

另一个可能性是使用带有样条曲线和对数链接的method="glm"(也尝试过method="gam",但其自动复杂度调整会将波动性降低得太多):

library(splines)
ggplot(dt.1, aes(x=pctOAC,y=NoP, fill=Age)) +
    geom_bar(stat="identity",position=position_dodge()) +
    geom_smooth(aes(colour=Age), se=F,
                method="glm",
                formula=y~ns(x,8),
                family=gaussian(link="log"),
                show_guide = FALSE,lwd=0.7) +
    theme(legend.position=c(.2,0.8))

在此输入图片描述


4
< p > geom_density() 怎么样?< /p >
ggplot(dt1, aes(x=pctOAC,y=NoP, colour=Age, fill=Age)) +
  geom_bar(stat="identity",position=position_dodge()) +
  geom_density(stat="identity", fill=NA) +
  theme(legend.position=c(.2,0.8))

enter image description here


1
这看起来实际上根本没有平滑吗?不过,即使只是插值,有没有办法说服ggplot2在中间点处进行评估,相当于density中的n参数? - Ben Bolker
回顾过去,我认为stat_identitygeom_density结合起来并不是很有意义。 - Drew Steen

网页内容由stack overflow 提供, 点击上面的
可以查看英文原文,
原文链接