使用ggplot2可以绘制gam拟合的平滑组件吗?

27

我正在使用mgcv包中的gam模型进行拟合,并将结果存储在model中。到目前为止,我一直在使用plot(model)查看平滑组件。我最近开始使用ggplot2并喜欢它的输出。所以我想知道,是否可能使用ggplot2绘制这些图形?

以下是一个示例:

x1 = rnorm(1000)
x2 = rnorm(1000)
n = rpois(1000, exp(x1) + x2^2)

model = gam(n ~ s(x1, k=10) + s(x2, k=20), family="poisson")
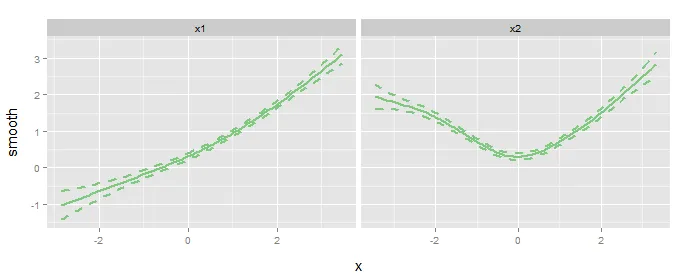
plot(model, rug=FALSE, select=1)
plot(model, rug=FALSE, select=2)

我对 s(x1, k=10)s(x2, k=20) 感兴趣,而不是适配。

部分回答:

我深入研究了 plot.gammgcv:::plot.mgcv.smooth,并构建了自己的函数,从平滑的组成部分中提取出预测效果和标准误差。它不能处理 plot.gam 的所有选项和情况,因此我仅认为它是一个部分解决方案,但它对我很有效。

EvaluateSmooths = function(model, select=NULL, x=NULL, n=100) {
  if (is.null(select)) {
    select = 1:length(model$smooth)
  }
  do.call(rbind, lapply(select, function(i) {
    smooth = model$smooth[[i]]
    data = model$model

    if (is.null(x)) {
      min = min(data[smooth$term])
      max = max(data[smooth$term])
      x = seq(min, max, length=n)
    }
    if (smooth$by == "NA") {
      by.level = "NA"
    } else {
      by.level = smooth$by.level
    }
    range = data.frame(x=x, by=by.level)
    names(range) = c(smooth$term, smooth$by)

    mat = PredictMat(smooth, range)
    par = smooth$first.para:smooth$last.para

    y = mat %*% model$coefficients[par]

    se = sqrt(rowSums(
      (mat %*% model$Vp[par, par, drop = FALSE]) * mat
    ))

    return(data.frame(
      label=smooth$label
      , x.var=smooth$term
      , x.val=x
      , by.var=smooth$by
      , by.val=by.level
      , value = y
      , se = se
    ))
  }))
}

这将返回一个“熔融”数据框与平滑组件,现在可以使用ggplot来处理上面的示例:
smooths = EvaluateSmooths(model)

ggplot(smooths, aes(x.val, value)) + 
  geom_line() + 
  geom_line(aes(y=value + 2*se), linetype="dashed") + 
  geom_line(aes(y=value - 2*se), linetype="dashed") + 
  facet_grid(. ~ x.var)

如果有人知道一种能够在一般情况下实现这一点的软件包,我将非常感激。
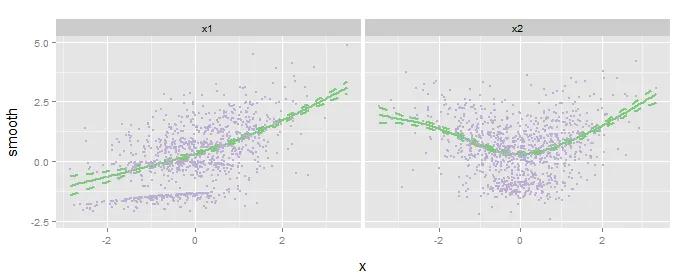
1
ggplot在geom_smooth中使用predict,因此只需使用method='gam' - Señor O
1
据我理解,geom_smooth 显示的是拟合而不是平滑项。所以我认为这不是解决方案。 - unique2
提供一个数据集的链接(以 mgcv 中的一个示例为起点,并说明您要复制的图形),我们可以(很可能)向您展示如何操作。 - IRTFM
4个回答

21

你可以使用visreg包和plyr包组合使用。visreg基本上可以绘制任何您可以使用predict()的模型。

library(mgcv)
library(visreg)
library(plyr)
library(ggplot2)

# Estimating gam model:
x1 = rnorm(1000)
x2 = rnorm(1000)
n = rpois(1000, exp(x1) + x2^2)
model = gam(n ~ s(x1, k=10) + s(x2, k=20), family="poisson")

# use plot = FALSE to get plot data from visreg without plotting
plotdata <- visreg(model, type = "contrast", plot = FALSE)

# The output from visreg is a list of the same length as the number of 'x' variables,
#   so we use ldply to pick the objects we want from the each list part and make a dataframe: 
smooths <- ldply(plotdata, function(part)   
  data.frame(Variable = part$meta$x, 
             x=part$fit[[part$meta$x]], 
             smooth=part$fit$visregFit, 
             lower=part$fit$visregLwr, 
             upper=part$fit$visregUpr))

# The ggplot:
ggplot(smooths, aes(x, smooth)) + geom_line() +
  geom_line(aes(y=lower), linetype="dashed") + 
  geom_line(aes(y=upper), linetype="dashed") + 
  facet_grid(. ~ Variable, scales = "free_x")
我们可以将整个内容放入一个函数中,并添加一个选项以显示模型残差(res = TRUE):
ggplot.model <- function(model, type="conditional", res=FALSE, 
                       col.line="#7fc97f", col.point="#beaed4", size.line=1, size.point=1) {
  require(visreg)
  require(plyr)
  plotdata <- visreg(model, type = type, plot = FALSE)
  smooths <- ldply(plotdata, function(part)   
    data.frame(Variable = part$meta$x, 
             x=part$fit[[part$meta$x]], 
             smooth=part$fit$visregFit, 
             lower=part$fit$visregLwr, 
             upper=part$fit$visregUpr))
  residuals <- ldply(plotdata, function(part)
    data.frame(Variable = part$meta$x, 
               x=part$res[[part$meta$x]], 
               y=part$res$visregRes))
  if (res)
    ggplot(smooths, aes(x, smooth)) + geom_line(col=col.line, size=size.line) +
      geom_line(aes(y=lower), linetype="dashed", col=col.line, size=size.line) +
      geom_line(aes(y=upper), linetype="dashed", col=col.line, size=size.line) +
      geom_point(data = residuals, aes(x, y), col=col.point, size=size.point) +
      facet_grid(. ~ Variable, scales = "free_x")
  else
    ggplot(smooths, aes(x, smooth)) + geom_line(col=col.line, size=size.line) +
      geom_line(aes(y=lower), linetype="dashed", col=col.line, size=size.line) +
      geom_line(aes(y=upper), linetype="dashed", col=col.line, size=size.line) +
      facet_grid(. ~ Variable, scales = "free_x")
  }

ggplot.model(model)
ggplot.model(model, res=TRUE)

不带残差的ggplot图 带残差的ggplot图 颜色来自于http://colorbrewer2.org/


现在您可以使用 plot=FALSE 参数来调用 visreg 函数,以返回绘图数据而不显示任何内容,而无需将其绘制到临时文件中。但是,请注意,返回的对象可能已经与您所预期的不同。 - Spacedman
帖子可能需要更新。如果我运行上面的代码,对象smooths返回为空,因此plyr::ldply()调用存在问题。 - pat-s
@pat-s 谢谢,你是对的。帖子现在已经更新,应该可以工作了。 - Dag Hjermann
如果我有许多“x”对象,我该如何将这个图形分成不同的行和列。 - user2698178

5

提醒一下,visreg可以直接输出一个gg对象:

visreg(model, "x1", gg=TRUE)

enter image description here


1

0

更新允许用户选择要绘制的变量。 将“残差”一词更改为“res_data”,以避免与residuals函数冲突。

ggplot.model <- function(model, type="conditional", res=FALSE, 
                       col.line="#7fc97f", col.point="#beaed4", size.line=1, size.point=1, no_col = NULL,
                       what = "all") {
  require(visreg)
  require(plyr)
  
  plotdata <- visreg(model, type = type, plot = FALSE)
  smooths <- ldply(plotdata, function(part)   
    data.frame(Variable = part$meta$x, 
             x=part$fit[[part$meta$x]], 
             smooth=part$fit$visregFit, 
             lower=part$fit$visregLwr, 
             upper=part$fit$visregUpr))
  res_data <- ldply(plotdata, function(part)
    data.frame(Variable = part$meta$x, 
               x=part$res[[part$meta$x]], 
               y=part$res$visregRes))
  
   if (what != "all") {
    smooths <- smooths %>%
      filter(lapply(Variable,as.character)%in% what)
    res_data <- res_data%>%
      filter(lapply(Variable,as.character)%in% what)
   }
  
  
  if (res)
    ggplot(smooths, aes(x, smooth)) + geom_line(col=col.line, size=size.line) +
      geom_line(aes(y=lower), linetype="dashed", col=col.line, size=size.line) +
      geom_line(aes(y=upper), linetype="dashed", col=col.line, size=size.line) +
      geom_point(data = res_data, aes(x, y), col=col.point, size=size.point) +
      facet_wrap(. ~ Variable, scales = "free_x", ncol = no_col) + theme_bw()
  else
    ggplot(smooths, aes(x, smooth)) + geom_line(col=col.line, size=size.line) +
      geom_line(aes(y=lower), linetype="dashed", col=col.line, size=size.line) +
      geom_line(aes(y=upper), linetype="dashed", col=col.line, size=size.line) +
      facet_wrap(. ~ Variable, scales = "free_x", ncol=no_col)
}

网页内容由stack overflow 提供, 点击上面的
可以查看英文原文,
原文链接