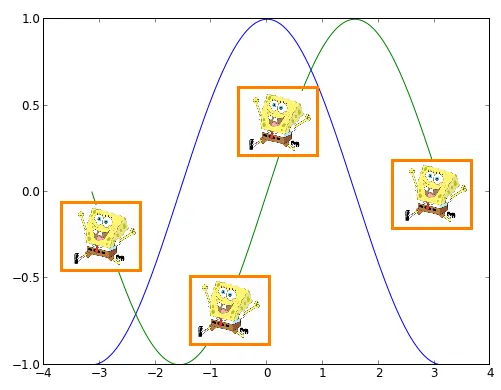
我希望能够在Python/Matplotlib中读取一系列图片并在图表中绘制这些图片,而不是使用其他标记(如点)。我已经尝试使用imshow,但没有成功,因为我无法将图像移到另一个位置并适当地缩放它。也许有人有好的想法:)


有两种方法可以实现这个功能。
imshow 函数绘制图像,通过设置 extent 参数来确定图像位置。AnnotationBbox 中使用 OffsetImage。第一种方法比较容易理解,但第二种方法具有很大的优势。注释框方法将允许图像在缩放时保持恒定的大小。而使用 imshow 会将图像的大小与绘图的数据坐标绑定。
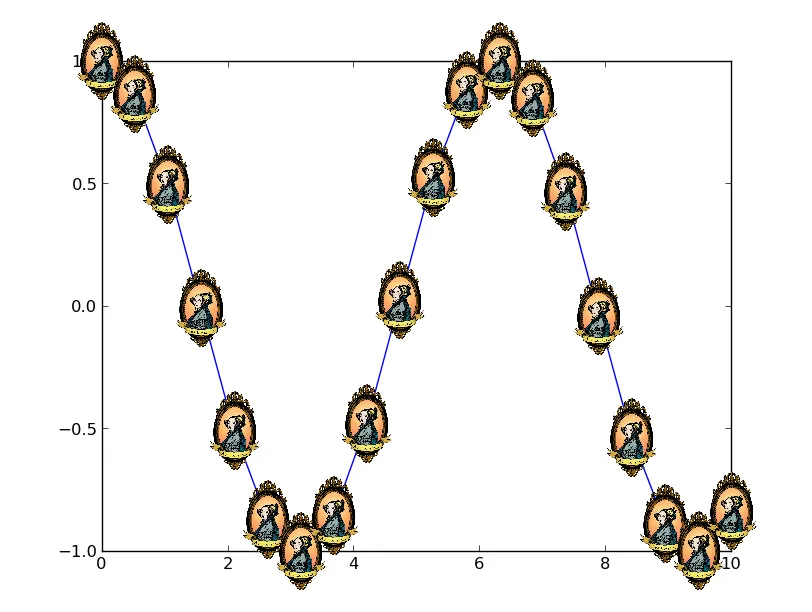
这里是第二个选项的示例:
import numpy as np
import matplotlib.pyplot as plt
from matplotlib.offsetbox import OffsetImage, AnnotationBbox
from matplotlib.cbook import get_sample_data

def main():
    x = np.linspace(0, 10, 20)
    y = np.cos(x)
    image_path = get_sample_data('ada.png')
    fig, ax = plt.subplots()
    imscatter(x, y, image_path, zoom=0.1, ax=ax)
    ax.plot(x, y)
    plt.show()

def imscatter(x, y, image, ax=None, zoom=1):
    if ax is None:
        ax = plt.gca()
    try:
        image = plt.imread(image)
    except TypeError:
        # Likely already an array...
        pass
    im = OffsetImage(image, zoom=zoom)
    x, y = np.atleast_1d(x, y)
    artists = []
    for x0, y0 in zip(x, y):
        ab = AnnotationBbox(im, (x0, y0), xycoords='data', frameon=False)
        artists.append(ax.add_artist(ab))
    ax.update_datalim(np.column_stack([x, y]))
    ax.autoscale()
    return artists

main()

如果你想要不同的图片:
现在这是谷歌搜索“matplotlib scatter with images”时出现的第一个回复。如果你和我一样确实需要在每张图上绘制不同的图片,那么请尝试使用以下这个简化的示例。只需确保输入自己的图片即可。
import matplotlib.pyplot as plt
from matplotlib.offsetbox import OffsetImage, AnnotationBbox

def getImage(path, zoom=1):
    return OffsetImage(plt.imread(path), zoom=zoom)

paths = [
    'a.jpg',
    'b.jpg',
    'c.jpg',
    'd.jpg',
    'e.jpg']

x = [0,1,2,3,4]
y = [0,1,2,3,4]

fig, ax = plt.subplots()
ax.scatter(x, y)

for x0, y0, path in zip(x, y,paths):
    ab = AnnotationBbox(getImage(path), (x0, y0), frameon=False)
    ax.add_artist(ab)
ax.add_artist(ab)。有可能这个例子中漏掉了吗? - Joshua R.ax.add_artist(ab)。 - Mitchell van Zuylenim = OffsetImage(plt.imread(path)),然后将for循环中的 getImage(path) 替换为 im。 - Mitchell van ZuylenOffsetImage 接受一个 zoom 参数。你可以尝试调整它,这可以使图像变小(或者甚至更大,我想)。 - Mitchell van Zuylen