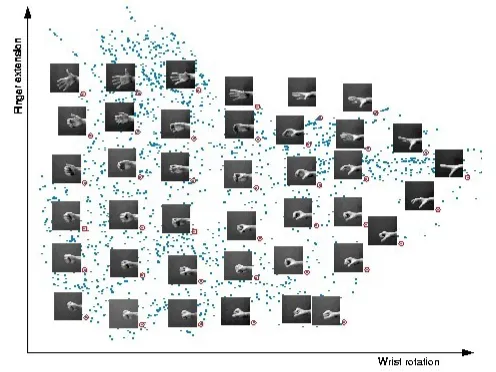
我有一组150x150像素的png图像和一组相应的(x, y)坐标,是否有办法将这些图像绘制成网格形式?例如,我正在寻找使用R或Python创建类似以下内容的解决方案:
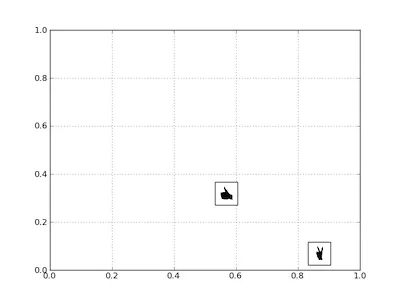
为显示每个图像,您需要实例化一个边界框(bounding box),通过创建AnnotationBbox对象来实现;将图像和其坐标传递到构造函数中。
对于这两张图片的代码显然是重复的,所以一旦该块被放入一个函数中,它就不会像这里看起来那么长。
import matplotlib.pyplot as PLT
from matplotlib.offsetbox import AnnotationBbox, OffsetImage
from matplotlib._png import read_png

fig = PLT.gcf()
fig.clf()
ax = PLT.subplot(111)

# add a first image
arr_hand = read_png('/path/to/this/image.png')
imagebox = OffsetImage(arr_hand, zoom=.1)
xy = [0.25, 0.45]               # coordinates to position this image

ab = AnnotationBbox(imagebox, xy,
    xybox=(30., -30.),
    xycoords='data',
    boxcoords="offset points")
ax.add_artist(ab)

# add second image
arr_vic = read_png('/path/to/this/image2.png')
imagebox = OffsetImage(arr_vic, zoom=.1)
xy = [.6, .3]                  # coordinates to position 2nd image

ab = AnnotationBbox(imagebox, xy,
    xybox=(30, -30),
    xycoords='data',
    boxcoords="offset points")
ax.add_artist(ab)

# rest is just standard matplotlib boilerplate
ax.grid(True)
PLT.draw()
PLT.show()
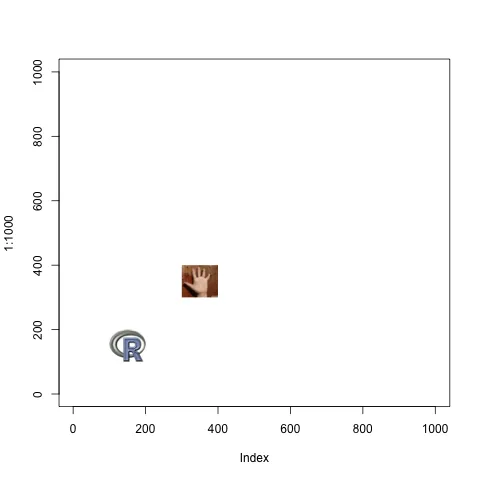
frameon=False 传递给 AnnotationBbox()。 - bdforbesR语言中一种实现该功能的方法(适用于2.11.0及以上版本):
library("png")
# read a sample file (R logo)
img <- readPNG(system.file("img", "Rlogo.png", package="png"))
# img2 <- readPNG(system.file("img", "Rlogo.png", package="png"))
img2 <- readPNG("hand.png", TRUE) # here import a different image
if (exists("rasterImage")) {
  plot(1:1000, type='n')
  rasterImage(img, 100, 100, 200, 200)
  rasterImage(img2, 300, 300, 400, 400)
}
详细信息请参见?readPNG和?rasterImage。
在R中,您可以使用TeachingDemos软件包中的my.symbols和ms.image函数。
require(grDevices)
#set up the plot region:
op <- par(bg = "thistle") <h>
plot(c(100, 250), c(300, 450), type = "n", xlab="", ylab="")
image <- as.raster(matrix(0:1, ncol=5, nrow=3))
rasterImage(image, 100, 300, 150, 350, interpolate=FALSE)
rasterImage(image, 100, 400, 150, 450)
rasterImage(image, 200, 300, 200 + xinch(.5), 300 + yinch(.3), interpolate=FALSE)
rasterImage(image, 200, 400, 250, 450, angle=15, interpolate=FALSE)
par(op)
这是一个很好的例子。