我希望在散点图和线图中使用自定义标记。如何将PNG文件制作成自定义标记?
如何在绘图中使用自定义PNG图像标记?
20
- tputkonen
2
1我建议将此标记为重复项:https://dev59.com/JGYq5IYBdhLWcg3wpiGk - heisenBug
可以通过检查是否存在包含适当符号的字体集来替换png图像,该符号可用作标记。可以使用标准的utf8符号,如Matplotlib自定义标记/符号,或者如果需要特定的字体,则可以参考如何在matplotlib中使用Font Awesome符号作为标记中的示例。 - ImportanceOfBeingErnest
3个回答
30
我不认为matplotlib能够像那样自定义标记。请参见这里,了解可用的自定义程度,但它远远不能满足您的需求。
作为替代方案,我编写了这个使用matplotlib.image在线点位置放置图像的hack方法。
import matplotlib.pyplot as plt
from matplotlib import image

# constant
dpi = 72
path = 'smile.png'
# read in our png file
im = image.imread(path)
image_size = im.shape[1], im.shape[0]

fig = plt.figure(dpi=dpi)
ax = fig.add_subplot(111)
# plot our line with transparent markers, and markersize the size of our image
line, = ax.plot((1,2,3,4),(1,2,3,4),"bo",mfc="None",mec="None",markersize=image_size[0] * (dpi/ 96))
# we need to make the frame transparent so the image can be seen
# only in trunk can you put the image on top of the plot, see this link:
# http://www.mail-archive.com/matplotlib-users@lists.sourceforge.net/msg14534.html
ax.patch.set_alpha(0)
ax.set_xlim((0,5))
ax.set_ylim((0,5))

# translate point positions to pixel positions
# figimage needs pixels not points
line._transform_path()
path, affine = line._transformed_path.get_transformed_points_and_affine()
path = affine.transform_path(path)
for pixelPoint in path.vertices:
    # place image at point, centering it
    fig.figimage(im,pixelPoint[0]-image_size[0]/2,pixelPoint[1]-image_size[1]/2,origin="upper")

plt.show()
结果生成:
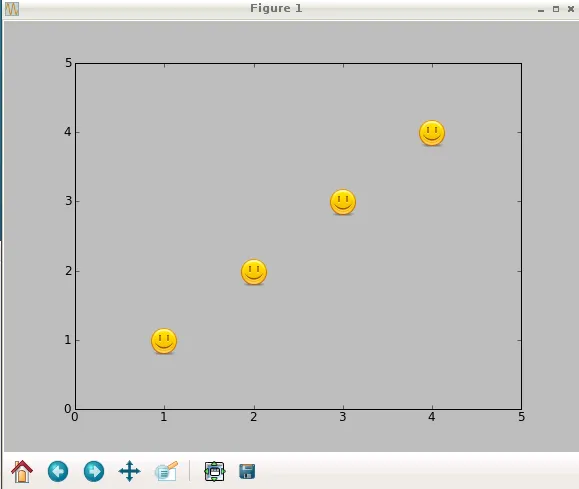
- Mark
2
4属性错误:'AxesSubplot' 对象没有 'get_frame' 属性。 - erogol
请参考t gillespie的答案来处理get_frame错误。 - Joel
9
继续Mark的回答。我想补充一下,因为我尝试运行它并实现了我想要的效果,但是没有在图表上显示图标。也许matplotlib已经发生了一些变化。毕竟已经过去4年了。
代码行:
ax.get_frame().set_alpha(0)
似乎不起作用,然而。
ax.patch.set_alpha(0)
能否正常工作。
- t gillespie
8
另一个答案可能会在调整图形大小时导致问题。这里提供一种不同的方法,将图像放置在注释框中,并以数据坐标为锚定点。
import numpy as np
import matplotlib.pyplot as plt
from matplotlib.offsetbox import OffsetImage, AnnotationBbox

path = "https://upload.wikimedia.org/wikipedia/commons/b/b5/Tango-example_icons.png"
image = plt.imread(path)[116:116+30, 236:236+30]

x = np.arange(10)
y = np.random.rand(10)

fig, ax = plt.subplots()
ax.plot(x,y)

def plot_images(x, y, image, ax=None):
    ax = ax or plt.gca()

    for xi, yi in zip(x,y):
        im = OffsetImage(image, zoom=72/ax.figure.dpi)
        im.image.axes = ax

        ab = AnnotationBbox(im, (xi,yi), frameon=False, pad=0.0,)

        ax.add_artist(ab)

plot_images(x, y, image, ax=ax)

plt.show()
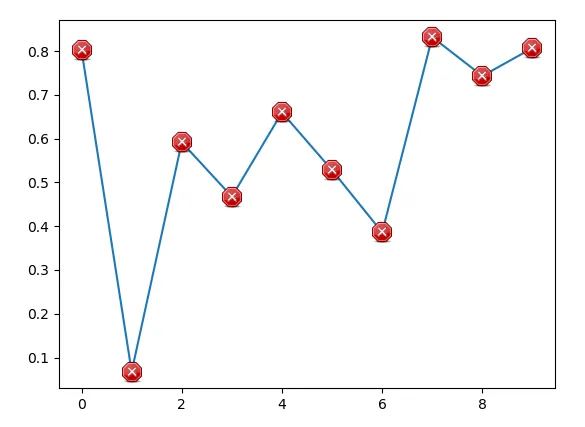
- ImportanceOfBeingErnest
网页内容由stack overflow 提供, 点击上面的可以查看英文原文,
原文链接
原文链接