有没有办法在pandas.DataFrame.plot中设置标记样式?通过设置kind,所有其他选项都可用。我想要一个带有误差棒的标记,但只得到了带有误差棒的线条。如果我通过errorbar函数来实现这一点,我会设置fmt='.'。
2个回答
5
这个问题并没有具体说明,但要看你是要绘制数据框还是系列。
绘制数据框
可以重复使用@unutbu的示例:
from numpy import arange, random
import pandas as pd
df = pd.DataFrame({'x': arange(10), 'y': random.randn(10), 'err': random.randn(10)})
df.plot('x', 'y', yerr='err', fmt='.')
在DataFrame中绘制Series
这次有点不同:
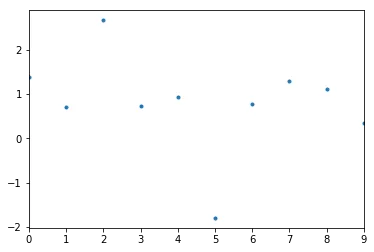
df.y.plot(fmt='.')
AttributeError: Unknown property fmt
您需要:
df.y.plot(style='.')
style与 DataFrame 的行为
如果将 style 传递给 DataFrame.plot,则 "没有发生任何事情":
df.plot('x', 'y', yerr='err', style='.')
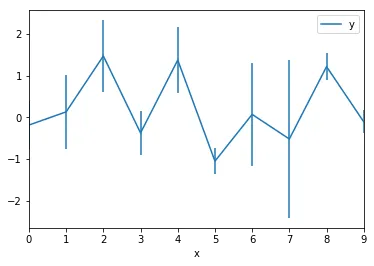
可能不是你想要的。
- Tomasz Gandor
4
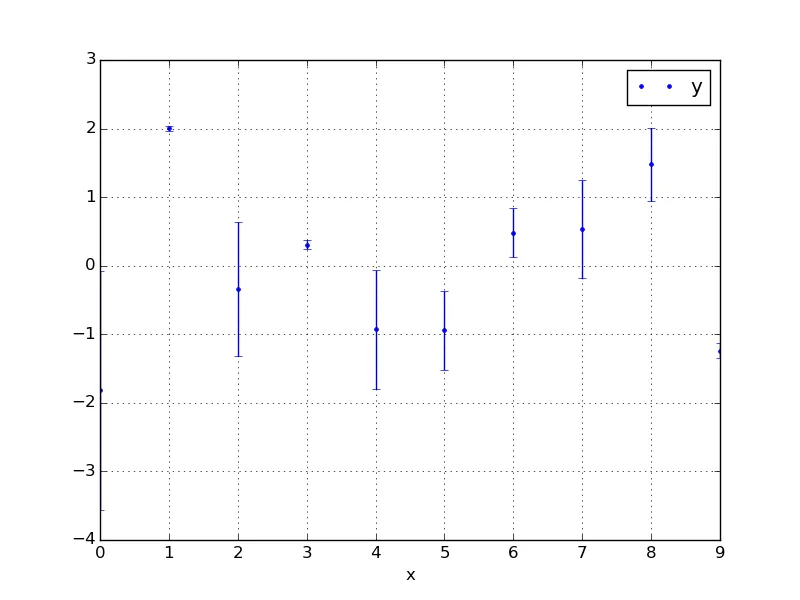
df.plot 会将额外的关键参数传递给底层的 matplotlib 绘图函数。因此,
df = pd.DataFrame({'x':np.arange(10), 'y':np.random.randn(10),
                   'err':np.random.randn(10)})
df.plot('x', 'y', yerr='err', fmt='.')
收益率
- unutbu
网页内容由stack overflow 提供, 点击上面的可以查看英文原文,
原文链接
原文链接
- 相关问题
- 4 实时DataFrame绘图
- 4 Pandas DataFrame - 如何对行进行分组和标记
- 4 为 Pandas DataFrame 绘图设置 xlim
- 3 Pandas DataFrame绘图:永久更改默认的颜色映射
- 3 Pandas DataFrame绘图:指定来自多级索引的列用于secondary_y
- 9 Pandas:DataFrame内嵌DataFrame
- 52 从Pandas DataFrame绘图时对数据点进行标注
- 4 在Pandas绘图中标记插值的NaN点
- 7 使用透视表生成的 Pandas DataFrame 进行绘图
- 3 使用 Pandas DataFrame 绘图并将其与另一个绘图并排显示
df.plot(style='.')吗? - EdChum