对于大量绘图脚本,我使用matplotlib的rcParams来配置pandas数据框的一些标准绘图设置。
这在颜色和字体大小方面效果很好,但不适用于默认的colormap,如此处所述
以下是我的目前方法:
# -*- coding: utf-8 -*-
import pandas as pd
import numpy as np
import matplotlib
import matplotlib.pyplot as plt
from matplotlib import cm
# global plotting options
plt.rcParams.update(plt.rcParamsDefault)
matplotlib.style.use('ggplot')
plt.rcParams['lines.linewidth'] = 2.5
plt.rcParams['axes.facecolor'] = 'silver'
plt.rcParams['xtick.color'] = 'k'
plt.rcParams['ytick.color'] = 'k'
plt.rcParams['text.color'] = 'k'
plt.rcParams['axes.labelcolor'] = 'k'
plt.rcParams.update({'font.size': 10})
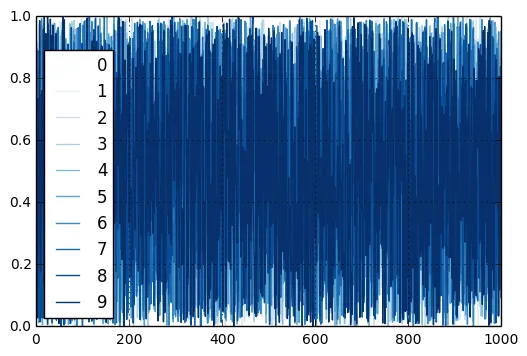
plt.rcParams['image.cmap'] = 'Blues' # this doesn't show any effect
# dataframe with random data
df = pd.DataFrame(np.random.rand(10, 3))
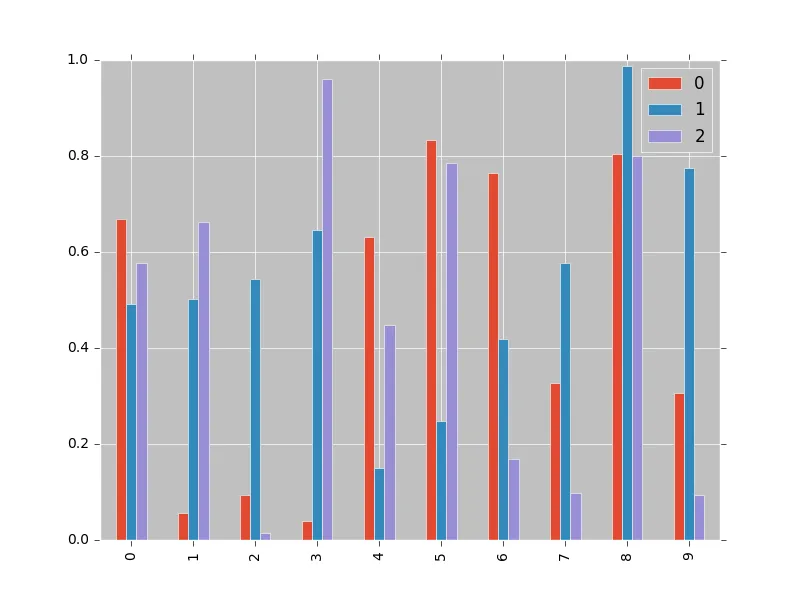
# this shows the standard colormap
df.plot(kind='bar')
plt.show()
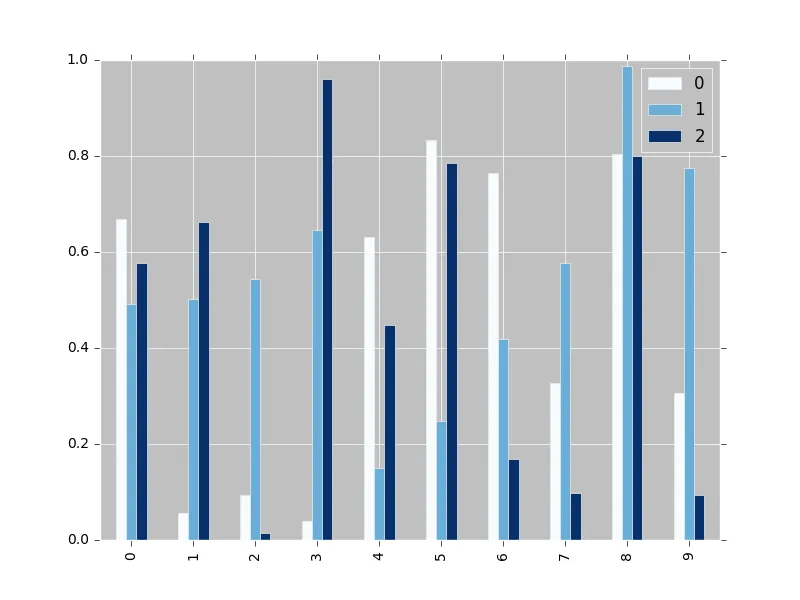
# this shows the right colormap
df.plot(kind='bar', cmap=cm.get_cmap('Blues'))
plt.show()
第一个图没有通过colormap使用颜色映射(通常应该这样做):
 只有在像第二个图那样将它作为参数传递时,它才会起作用:
 是否有办法永久定义pandas DataFrame绘图的标准colormap?
提前感谢!