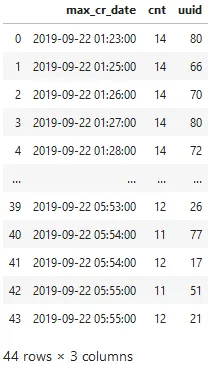
我有一个数据框:
df = pd.DataFrame({"max_cr_date":{"0":1569115380000,"1":1569115500000,"2":1569115560000,"3":1569115620000,"4":1569115680000,"5":1569115740000,"6":1569115800000,"7":1569115860000,"8":1569115920000,"9":1569115980000,"10":1569116040000,"11":1569116100000,"12":1569116160000,"13":1569116220000,"14":1569130800000,"15":1569130800000,"16":1569130800000,"17":1569130800000,"18":1569130860000,"19":1569130860000,"20":1569130860000,"21":1569130860000,"22":1569131100000,"23":1569131100000,"24":1569131160000,"25":1569131160000,"26":1569131220000,"27":1569131220000,"28":1569131280000,"29":1569131280000,"30":1569131340000,"31":1569131340000,"32":1569131400000,"33":1569131400000,"34":1569131460000,"35":1569131460000,"36":1569131520000,"37":1569131520000,"38":1569131580000,"39":1569131580000,"40":1569131640000,"41":1569131640000,"42":1569131700000,"43":1569131700000},"cnt":{"0":14,"1":14,"2":14,"3":14,"4":14,"5":14,"6":14,"7":14,"8":14,"9":14,"10":14,"11":14,"12":14,"13":14,"14":11,"15":12,"16":13,"17":14,"18":11,"19":12,"20":13,"21":14,"22":11,"23":12,"24":11,"25":12,"26":11,"27":12,"28":11,"29":12,"30":11,"31":12,"32":11,"33":12,"34":11,"35":12,"36":11,"37":12,"38":11,"39":12,"40":11,"41":12,"42":11,"43":12},"uuid":{"0":80,"1":66,"2":70,"3":80,"4":72,"5":110,"6":358,"7":123,"8":110,"9":123,"10":96,"11":89,"12":83,"13":58,"14":7,"15":28,"16":9,"17":5,"18":129,"19":116,"20":266,"21":87,"22":57,"23":86,"24":99,"25":36,"26":89,"27":30,"28":88,"29":18,"30":75,"31":26,"32":94,"33":29,"34":81,"35":32,"36":64,"37":19,"38":74,"39":26,"40":77,"41":17,"42":51,"43":21}})
df.max_cr_date = pd.to_datetime(df.max_cr_date, unit='ms')
df
df.max_cr_date.agg(['min', 'max'])

min   2019-09-22 01:23:00
max   2019-09-22 05:55:00
Name: max_cr_date, dtype: datetime64[ns]
当我尝试使用seaborn绘制数据框时,我的xlim出现错误。例如,max_cr_date范围从2019-09-22 01:23:00到2019-09-22 05:55:00,但在图表上,您可以看到2000年,2004年...
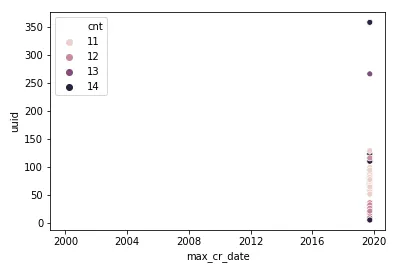
如何将xlim设置为max_cr_date列的最小/最大值?
谢谢。
