如何在限制x轴之后自动设置y轴限制

5
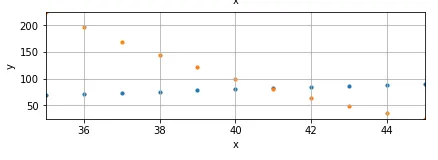
假设我有一些数据集想要一起绘制。然后我想要在某个部分进行缩放(例如使用ax.set_xlim、plt.xlim或plt.axis)。当我这样做时,它仍然保留缩放之前计算出的范围。我如何使其重新调整为当前显示的内容?
例如,使用:
import matplotlib
import matplotlib.pyplot as plt
import matplotlib.gridspec as gridspec

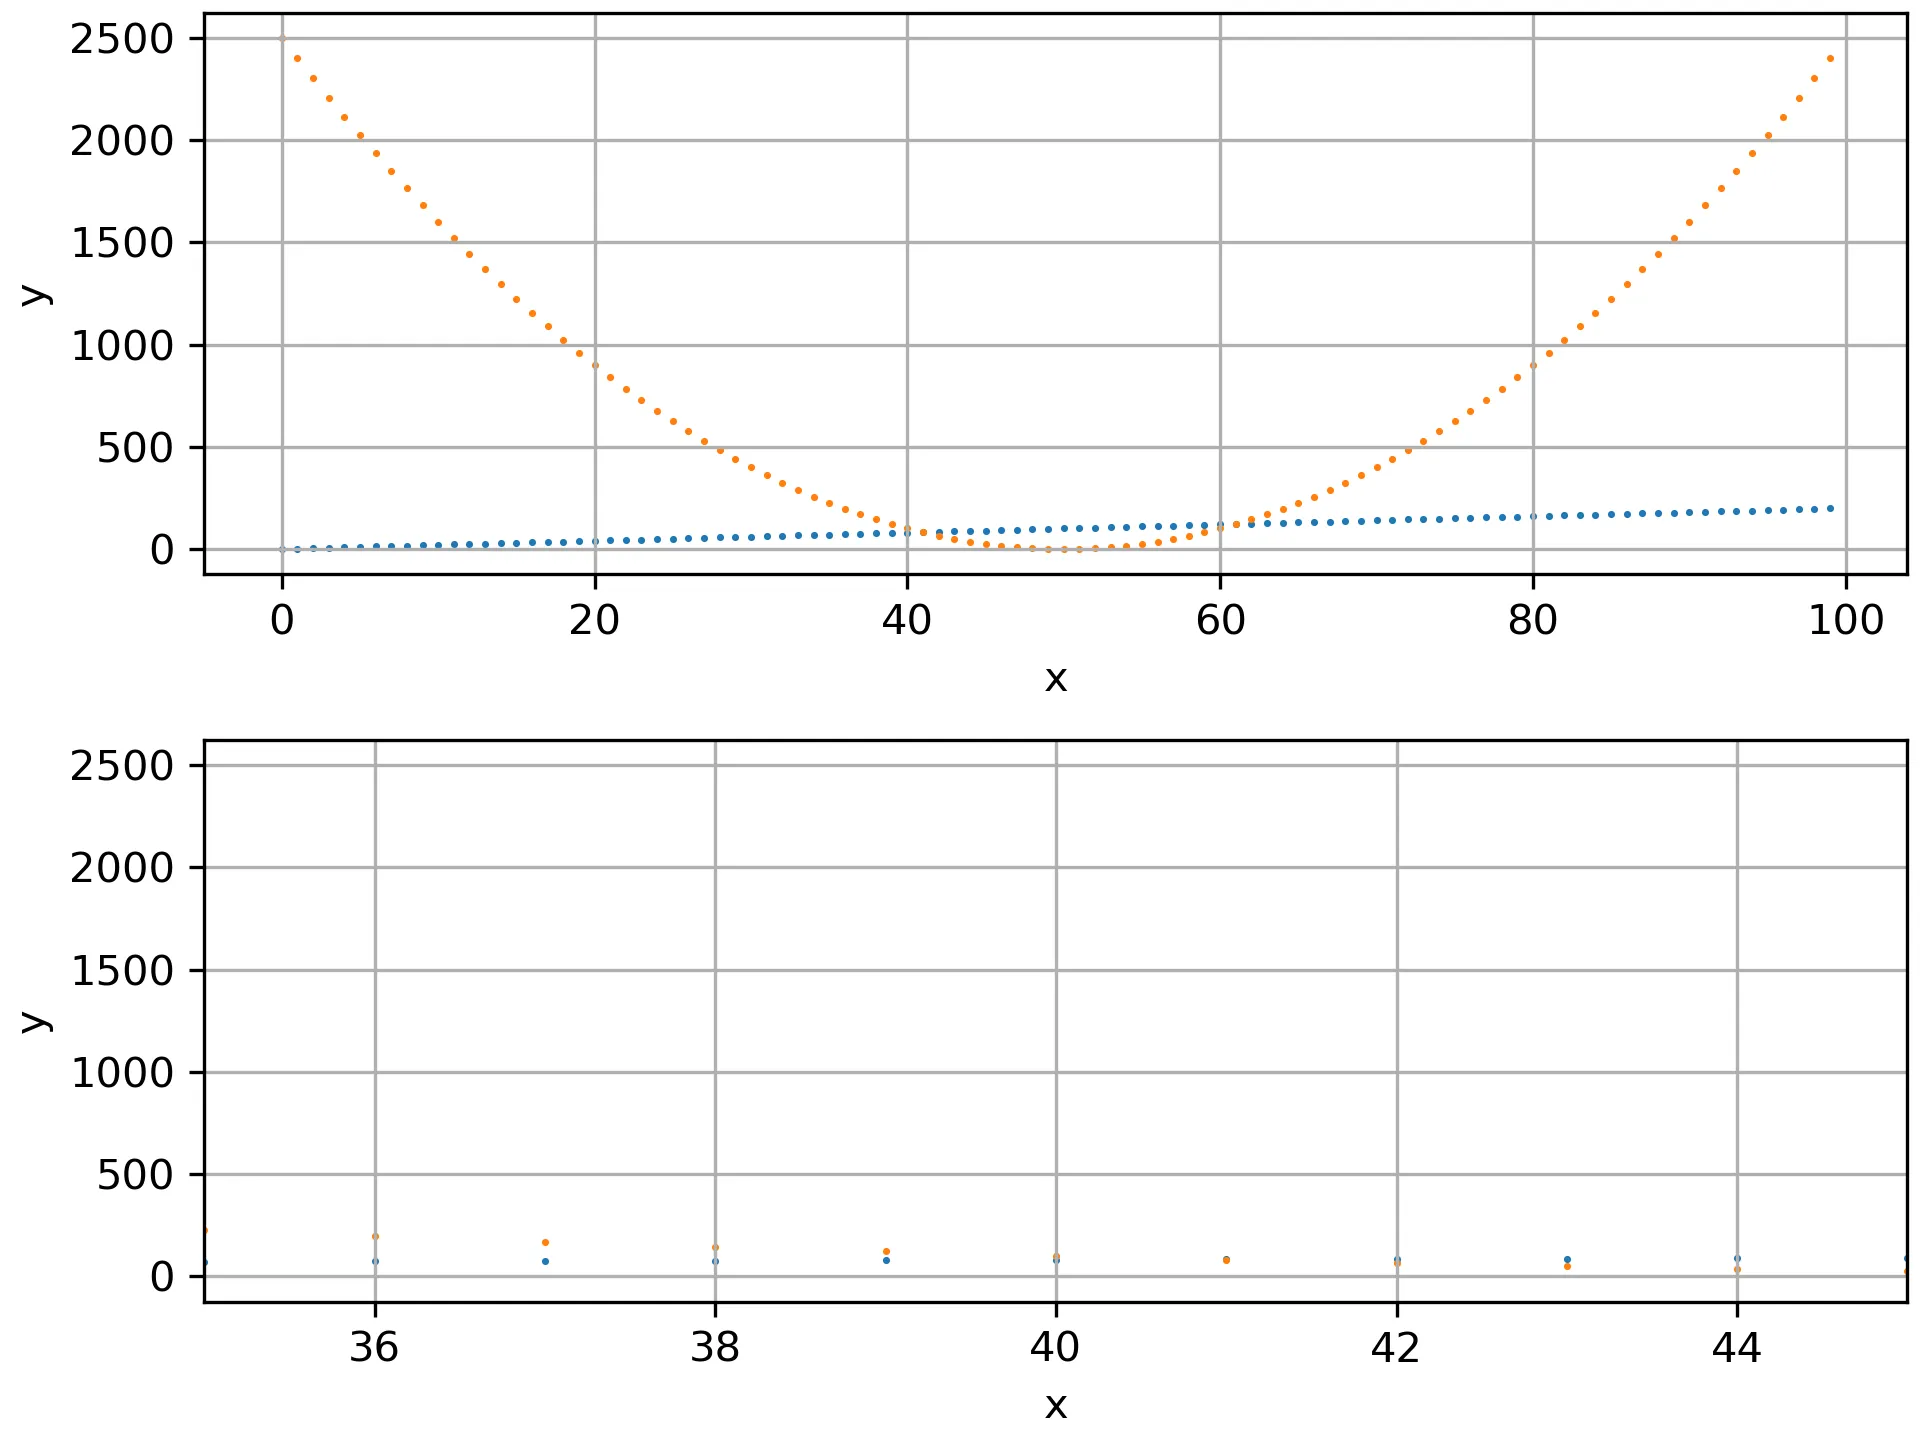
data_x = [d for d in range(100)]
data_y = [2*d for d in range(100)]
data_y2 = [(d-50)*(d-50) for d in range(100)]

fig = plt.figure(constrained_layout=True)
gs = gridspec.GridSpec(2, 1, figure=fig)

ax1 = fig.add_subplot(gs[0, 0])
ax1.grid()
ax1.set_xlabel('x')
ax1.set_ylabel('y')
ax1.scatter(data_x, data_y, s=0.5)
ax1.scatter(data_x, data_y2, s=0.5)

ax2 = fig.add_subplot(gs[1, 0])
ax2.grid()
ax2.set_xlabel('x')
ax2.set_ylabel('y')
ax2.scatter(data_x, data_y, s=0.5)
ax2.scatter(data_x, data_y2, s=0.5)
ax2.set_xlim(35,45)

fig.savefig('scaling.png', dpi=300)
plt.close(fig)

生成哪个

failed zoom

如您所见,下面的图表由于y轴保持与非限制版本相同的范围而难以看到某些东西。
我尝试使用relimautoscaleautoscale_view,但都没有成功。对于单个数据集,我可以使用ylim来设置该数据集的最小值和最大值。但对于不同的数据集,我必须查看所有数据集。
有没有更好的方法来强制重新计算y轴范围?

2
可能是重复问题:https://dev59.com/al0b5IYBdhLWcg3wM-8c。我还没有用那个关闭这个问题,以防在过去的6年中matplotlib添加了新功能,更优雅地解决了这个问题。 - tmdavison
1个回答

2
  • 将列表转换为numpy数组
    • 基于xlim_minxlim_max创建data_x的布尔掩码
    • 使用掩码选择y数据中相关的数据点
    • 组合两个选定的y数组
    • 从所选的y值中选择最小和最大值,并将它们设置为ylim
import numpy as np
import matplotlib.pyplot as plt

# use a variable for the xlim limits
xlim_min = 35
xlim_max = 45

# convert lists to arrays
data_x = np.array(data_x)
data_y = np.array(data_y)
data_y2 = np.array(data_y2)

# create a mask for the values to be plotted based on the xlims
x_mask = (data_x >= xlim_min) & (data_x <= xlim_max)

# use the mask on y arrays
y2_vals = data_y2[x_mask]
y_vals = data_y[x_mask]

# combine y arrays
y_all = np.concatenate((y2_vals, y_vals))

# get min and max y
ylim_min = y_all.min()
ylim_max = y_all.max()

# other code from op
...

# use the values to set xlim and ylim
ax2.set_xlim(xlim_min, xlim_max)
ax2.set_ylim(ylim_min, ylim_max)

enter image description here

# use a variable for the xlim limits
xlim_min = 35
xlim_max = 45

# convert lists to arrays
data_x = np.array(data_x)
data_y = np.array(data_y)
data_y2 = np.array(data_y2)

# create a mask for the values to be plotted based on the xlims
x_mask = (data_x >= xlim_min) & (data_x <= xlim_max)

# use the mask on x
x_vals = data_x[x_mask]

# use the mask on y
y2_vals = data_y2[x_mask]
y_vals = data_y[x_mask]

# other code from op
...

# plot
ax2.scatter(x_vals, y_vals, s=0.5)
ax2.scatter(x_vals, y2_vals, s=0.5)

网页内容由stack overflow 提供, 点击上面的
可以查看英文原文,
原文链接