Matplotlib:绘制两个x轴,一个线性的,一个具有对数刻度

5
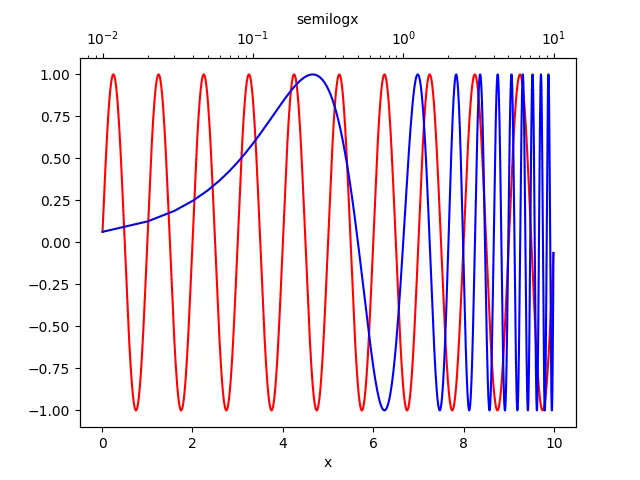
在Python的Matplotlib中,我想用两个x轴绘制y关于x的图表,其中一个下面有线性刻度,另一个上面有对数刻度。
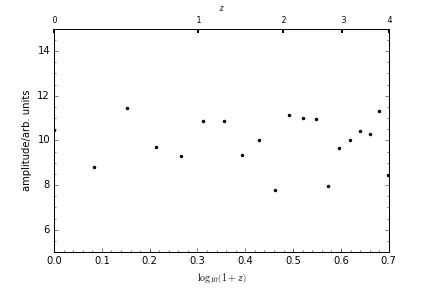
下面的x值是上面的任意函数(在这种情况下,映射为func(x)=np.log10(1.0+x))。推论:上面的x刻度位置是下面的同一任意函数。
数据点和两个轴的刻度位置必须解耦。我希望上轴的对数刻度位置和标签尽可能整齐。
如何最好地生成这样的图表?
相关链接: http://matplotlib.1069221.n5.nabble.com/Two-y-axis-with-twinx-only-one-of-them-logscale-td18255.html

类似(但未回答)的问题?:Matplotlib:如何在对数图中设置双轴刻度

可能有用:https://dev59.com/u4nda4cB1Zd3GeqPBZpL#29592508


你尝试过twiny()吗? - Marco
@BusyBeaver 我还没有使用 twinx() - 你能给个答案吗? - jtlz2
你想在两个x轴之间共享y轴(对吧?),所以使用twiny()函数。 - Marco
啊 - 是的 - 正确 - jtlz2
3
问题在于当两个不同比例尺的关系是非线性的时候,无法在相同位置显示相同的数据。这是数学问题。你可以使用两种类似但刻度标签不同的比例尺来解决这个问题。现在的问题是,由于这个原因,期望的结果并不清楚,因此你没有收到任何有用的答案。 - ImportanceOfBeingErnest
显示剩余3条评论
2个回答

3

您可能会发现Axes.twiny()Axes.semilogx()很有用。

import numpy as np
import matplotlib.pyplot as plt

fig, ax1 = plt.subplots()

x = np.arange(0.01, 10.0, 0.01) # x-axis range
y = np.sin(2*np.pi*x) # simulated signal to plot

ax1.plot(x, y, color="r") # regular plot (red)
ax1.set_xlabel('x')

ax2 = ax1.twiny() # ax1 and ax2 share y-axis
ax2.semilogx(x, y, color="b") # semilog plot (blue)
ax2.set_xlabel('semilogx')

plt.show()


我需要一个数据点集(只有一个数据系列)。我采纳了您的想法,但它给出了上述结果;我需要在上部x轴上做一些操作才能实现 - 我想看到yzlog10(1+z)同时变化的方式。 - jtlz2
例如,您的图中,指数为10的0次方在顶部应与底部的1.0对齐吗? - jtlz2
但是上面的是对数刻度吗?我想在顶部使用对数刻度,底部使用线性刻度。 - jtlz2
现在你完全把我搞糊涂了 :) 你不想将信号半对数绘制(蓝色),而是只想绘制红色,并在上面的 x轴 上显示“更多”刻度? - Marco
谢谢!我已经使用你的ticky()提示添加了一个答案,并根据我们的讨论 - 准备修改问题以使其更好地提出。 - jtlz2
显示剩余3条评论

0
这里是在和几个人交谈并感谢@BusyBeaver之后尝试回答的结果。
我同意这个问题表述不清,将进行修改以澄清(欢迎帮助!)。
我认为这是一个有用的问题可以记录在stackoverflow上。
代码:
import numpy as np
import matplotlib.pyplot as plt
from matplotlib.ticker import AutoMinorLocator

# Necessary functions

def tick_function(x):
    """Specify tick format"""
    return ["%2.f" % i for i in x]

def func(x):
    """This can be anything you like"""
    funcx=np.log10(1.0+x)
    return funcx

z=np.linspace(0.0,4.0,20)

np.random.seed(seed=1234)
y=np.random.normal(10.0,1.0,len(z))

# Set up the plot
fig,ax1 = subplots()
ax1.xaxis.set_minor_locator(AutoMinorLocator())
ax1.yaxis.set_minor_locator(AutoMinorLocator())

# Set up the second axis
ax2 = ax1.twiny()

# The tick positions can be at arbitrary positions
zticks=np.arange(z[0],z[-1]+1)
ax2.set_xticks(func(zticks))
ax2.set_xticklabels(tick_function(zticks))
ax2.set_xlim(func(z[0]),func(z[-1]))
ax1.set_ylim(5.0,15.0)

ax1.set_xlabel(r'$\log_{10}\left(1+z\right)$')
ax2.set_xlabel(r'$z$')
ax1.set_ylabel('amplitude/arb. units')

plt.tick_params(axis='both',which = 'major', labelsize=8, width=2)
plt.tick_params(axis='both',which = 'minor', labelsize=8, width=1)

_=ax1.plot(func(z),y,'k.')

plt.savefig('lnopz2.png')

Plot generated from the above code

我不确定如何控制上部ax2次刻度(例如每0.5)。


我仍然不明白在阅读情节时这有什么用处 ;) - Marco
因为我想跟踪这两个(相关的)变量,否则我就必须一直进行心理转换。 - jtlz2
那么它是否不是 https://stackoverflow.com/questions/45440474/matplotlib-twinx-wrong-values-on-second-axis 的重复? - ImportanceOfBeingErnest

网页内容由stack overflow 提供, 点击上面的
可以查看英文原文,
原文链接