Matplotlib:生成多个具有不同和反向比例的双轴

3

我想在两个x和y轴上绘制数据序列,以便拥有4个不同的轴。首先是x(能量,以电子伏特为单位)与y(标准化计数)轴,然后是x(波长,与能量成反比)与y(计数)轴。我的代码如下:

import numpy as np
import matplotlib.pyplot as plt
import matplotlib.mlab as mlab
from scipy.constants import h, c, e


def E(wavelength):
   return (h*c)/(wavelength*e)

wavelen = np.linspace(800e-9,1600e-9,200)
E_eV = E(wavelen)
loc, scale = 950e-9, 3.0
counts = mlab.normpdf(wavelen,950e-9,100e-9)/100
counts_norm = counts/10000


fig, ax  = plt.subplots()

ax1 = ax
ax2 = ax.twinx()
ax3 = ax.twiny()

plt.ticklabel_format(style='sci', scilimits=(0,0))

ax1.plot(E_eV, counts_norm)
ax1.set_xlim(E(1600e-9),E(800e-9))
ax1.set_ylabel('normalized counts')
ax1.set_xlabel('energy (eV)')
ax2.plot(E_eV, counts)
ax2.set_xlim(E(1600e-9),E(800e-9))
ax2.set_ylabel('counts')
ax3.plot(wavelen*1e9, counts_norm)
ax3.set_xlim(1600,800)
ax3.set_xlabel('wavelength (nm)')
ax3.ticklabel_format(style='plain')


plt.tight_layout()
plt.show()

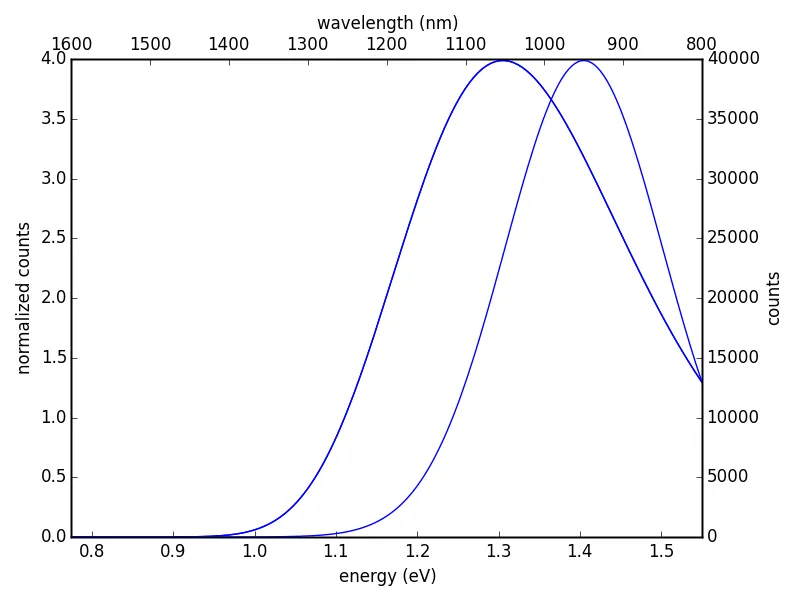
如您所见,这些曲线没有按正确方式进行缩放,以便它们在x轴方向上重叠并具有相同的尺寸。您能否帮我设置顶部x(波长)轴的正确参数?

1个回答

2

我建议只在主轴上绘制图表,然后同步双轴的标签。我编辑了您的示例,以展示如何在静态图中实现此目标。

import numpy as np
import matplotlib.pyplot as plt
import matplotlib.mlab as mlab
from scipy.constants import h, c, e

def E(wavelength):
    return (h*c)/(wavelength*e)
def getWaveLength(energy):
    return (h*c)/(energy*e)
def getCounts(normcounts):
    return normcounts*1000

wavelen = np.linspace(800e-9,1600e-9,200)
E_eV = E(wavelen)
loc, scale = 950e-9, 3.0
counts = mlab.normpdf(wavelen,950e-9,100e-9)/100
counts_norm = counts/10000

fig, ax1  = plt.subplots()

ax2 = ax1.twinx()
ax3 = ax1.twiny()

plt.ticklabel_format(style='sci', scilimits=(0,0))

ax1.plot(E_eV, counts_norm)
ax1.set_xlim(E(1600e-9),E(800e-9))
ax1.set_ylabel('normalized counts')
ax1.set_xlabel('energy (eV)')
ax2.set_ylabel('counts')
ax3.set_xlabel('wavelength (nm)')
ax3.ticklabel_format(style='plain')

# get the primary axis x tick locations in plot units
xtickloc = ax1.get_xticks() 
# set the second axis ticks to the same locations
ax3.set_xticks(xtickloc)
# calculate new values for the second axis tick labels, format them, and set them
x2labels = ['{:.3g}'.format(x) for x in getWaveLength(xtickloc)]
ax3.set_xticklabels(x2labels)
# force the bounds to be the same
ax3.set_xlim(ax1.get_xlim()) 

#same for y
ytickloc = ax1.get_yticks()
ax2.set_yticks(ytickloc)
ax2.set_yticklabels([str(int(y)) for y in getCounts(ytickloc)])
ax2.set_ylim(ax1.get_ylim())

plt.tight_layout()
plt.show()

静态轴可能是一个解决方案,但实际上我希望格式化程序可以自动计算刻度。 - beneminzl
我已经通过将我的例子中的方法打包成一个函数,并使用定时器周期性地调用它,以交互方式在我的应用程序中完成了此操作。定时器被用于此目的。 - Static Void

网页内容由stack overflow 提供, 点击上面的
可以查看英文原文,
原文链接