假设我有一组不等式:
  -2x + y <= -3
1.25x + y <= 2.5
        y >= -3
我可以将信息总结如下:
mat <- matrix(c(-2, 1, 1.25, 1, 0, 1), nrow = 3, byrow = TRUE)
dir <- c("<=", "<=", ">=")
rhs <- c(-3, 2.5, -3)
我编写了以下函数来绘制不等式:
plot(0, 0, xlim = c(-1, 5), ylim = c(-4, 1))
plot_ineq <- function(mat, dir, rhs, xlow, xhigh){
  line <- list()
  for(i in 1:nrow(mat)){
    if(mat[i, 2] > 0){
      line[[i]] <- sapply(seq(xlow, xhigh, 0.1), function(x) (rhs[i] - mat[i, 1] * x)/mat[i, 2])
    }else if(mat[i, 2] < 0){
      line[[i]] <- sapply(seq(xlow, xhigh, 0.1), function(x) (rhs[i] - mat[i, 1] * x)/mat[i, 2])
      if(dir[i] == ">="){
        dir[i] = "<="
      }else dir[i] = ">="
    }
    lines(seq(xlow, xhigh, 0.1), line[[i]])
  }
}

plot_ineq(mat = mat, dir = dir, rhs = rhs, xlow = -1, xhigh = 5)
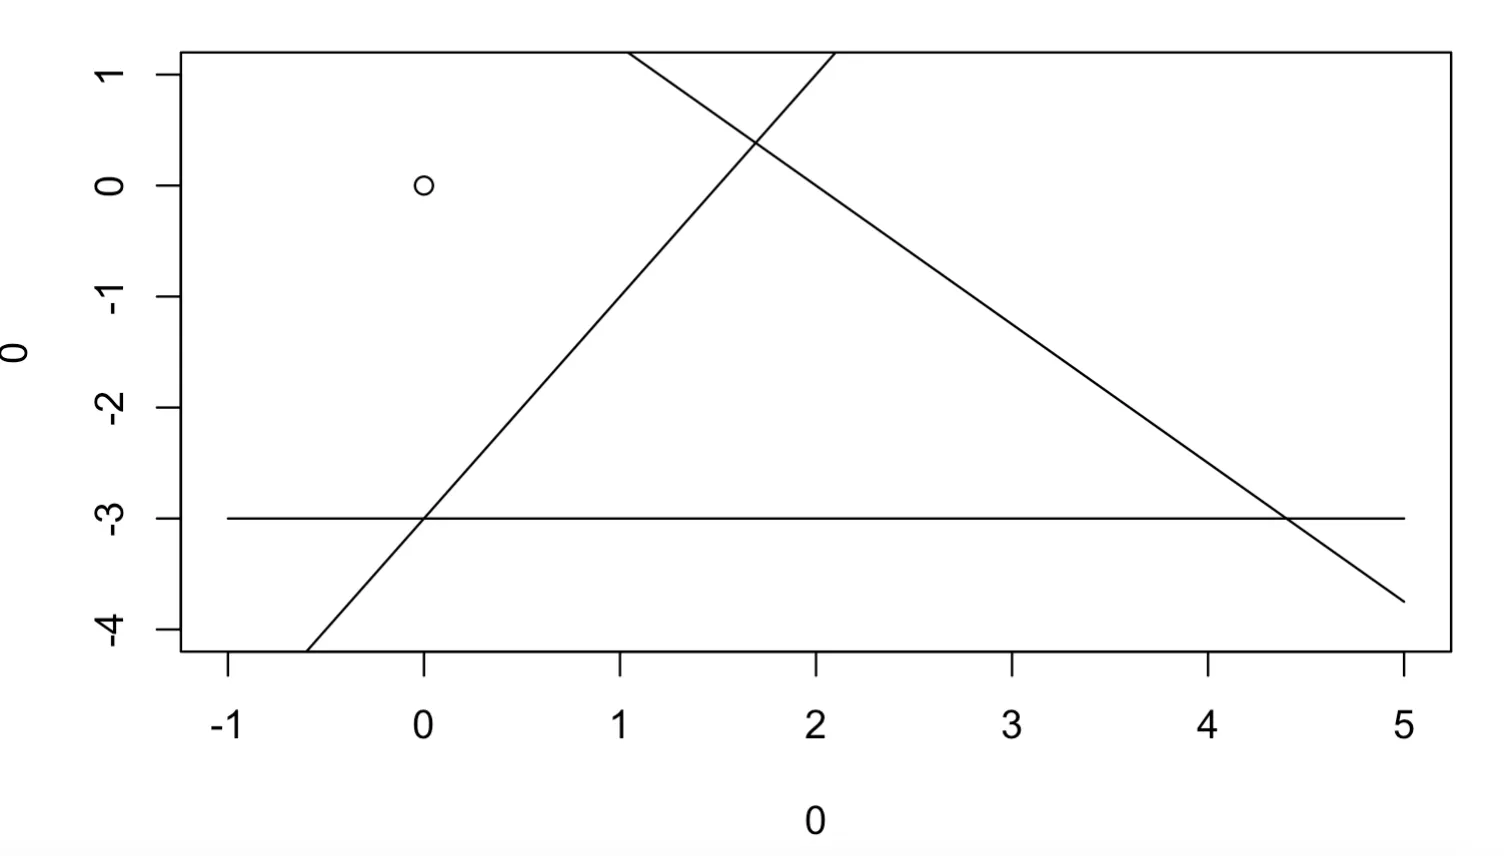
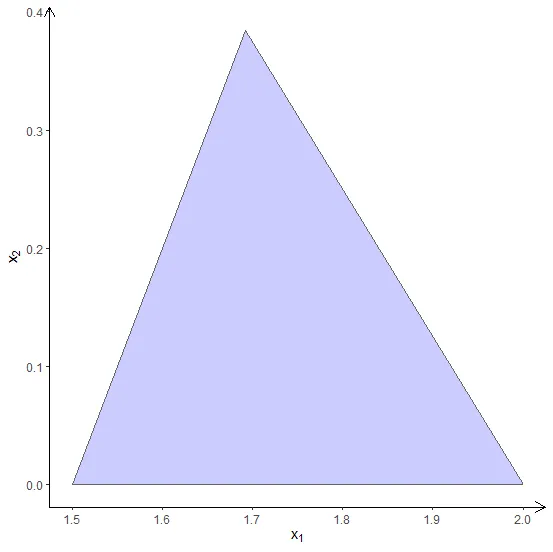
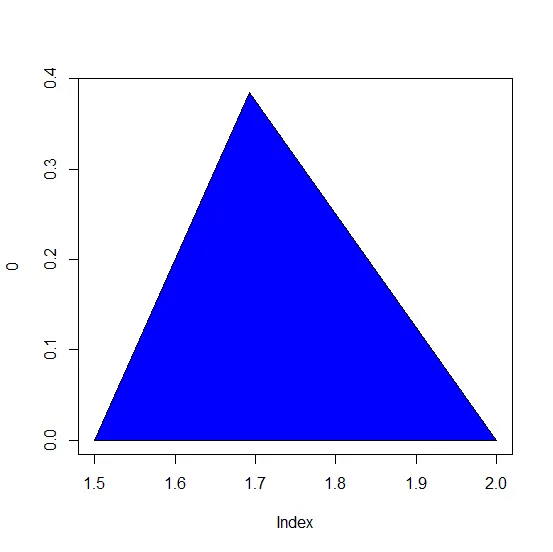
我只是想着色上述不等式描述的区域,而不是(0,0)所在的位置。
plot(0, 0, type = "n", etc)绘制(0,0),类型为“n”,等等。 - Rui Barradasplot(NULL, xlim = c(-1, 5), ylim = c(-4, 1))- G5W