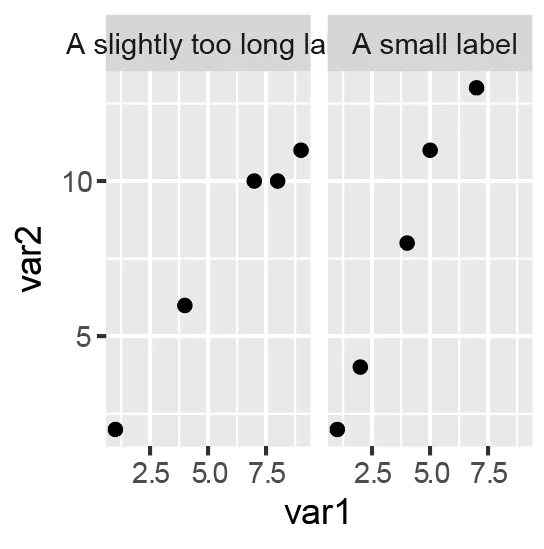
我有一个带有条形标签的分面图,由于分面的宽度而被裁剪 - 我一直在Inkscape中手动删除此裁剪,但希望可以在R中完成。请参见以下简单可重现的示例(图形宽度不可协商,需要导出为.eps文件):
library(tidyverse)

# Build data frame
df <- data.frame(treatment = factor(c(rep("A small label", 5), rep("A slightly too long label", 5))),
             var1 = c(1, 4, 5, 7, 2, 8, 9, 1, 4, 7),
             var2 = c(2, 8, 11, 13, 4, 10, 11, 2, 6, 10))

# Plot scatter graph with faceting by 'treatment'
p <- ggplot(df, aes(x = var1, y = var2)) +
  geom_point() +
  facet_wrap(treatment ~ ., ncol = 2)

# Save graph as .eps
ggsave(filename = "Graph1.eps", plot = p, device = "eps", width = 60, height = 60, units = "mm")
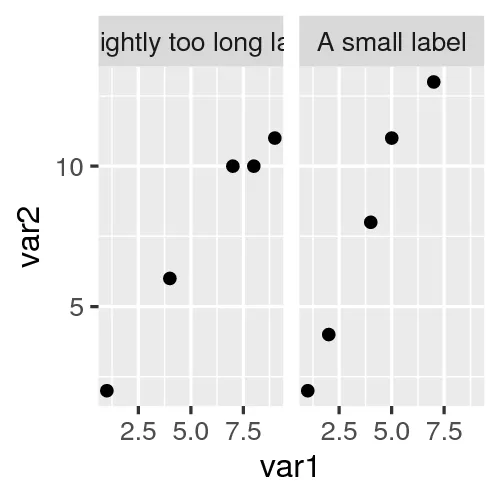
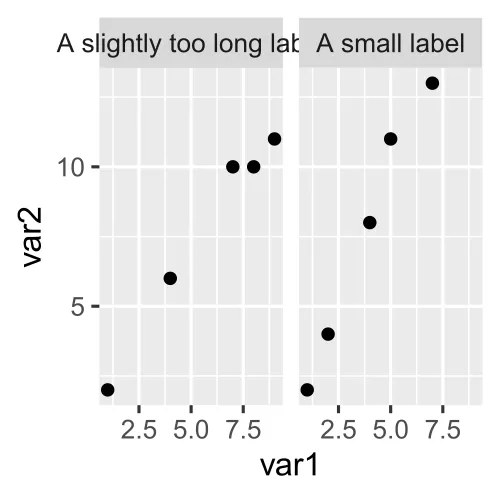
我想要的是这个,其中分面标签超出了分面的宽度:
到目前为止,我已经尝试了这个 StackOverflow 问题中提供的以下方法:
# This doesn't affect the strip labels
p2 <- p +
  coord_cartesian(clip = "off")

ggsave(filename = "Graph.eps", plot = p2, device = "eps", width = 60, height = 60, units = "mm")

# This doesn't affect strip labels and results in a blank white graph when exported using ggsave
p3 <- p
p3$layout$clip = "off"

ggsave(filename = "Graph.eps", plot = p3, device = "eps", width = 60, height = 60, units = "mm")
我也尝试过从这个问题中关闭布局$clip的方式,但是它与上述问题一样,带有条形标签仍然被裁剪,而ggsave导出的文件为空。
p4 <- ggplot_gtable(ggplot_build(p))
p4$layout$clip[p4$layout$name == "panel"] <- "off"
p4 <- grid.draw(p4)

ggsave(filename = "Graph.eps", plot = p4, device = "eps", width = 60, height = 60, units = "mm")