以下是我想到的内容。我在您的样例上进行了测试,看起来可以正常工作,但如果在其他地方出现问题,请提前谅解。我不得不深入到grob版本中获取宽度/高度信息,并根据图形是否被分面,"unit"属性信息位于不同的位置。
希望更熟悉grid包中unit对象的人能够给予帮助,以下是我的成果:
ggsave_autosize <- function(filename, plot = last_plot(), device = NULL, path = NULL, scale = 1,
max.dimension = 10, units = c("in", "cm", "mm"),
dpi=300, limitsize = TRUE){
sumUnitNull <- function(x){
res <- 0
for(i in 1:length(x)){
check.unit <- ifelse(!is.null(attr(x[i], "unit")), attr(x[i], "unit"),
ifelse(!is.null(attr(x[i][[1]], "unit")), attr(x[i][[1]], "unit"), NA))
if(!is.na(check.unit) && check.unit == "null") res <- res + as.numeric(x[i])
}
return(res)
}
w <- ggplotGrob(plot)$widths
h <- ggplotGrob(plot)$heights
w.max <- grid::unit(max.dimension, units) %>% grid::convertUnit("in") %>% as.numeric()
h.max <- grid::unit(max.dimension, units) %>% grid::convertUnit("in") %>% as.numeric()
w.in <- w %>% grid::convertUnit("in") %>% as.numeric() %>% sum()
h.in <- h %>% grid::convertUnit("in") %>% as.numeric() %>% sum()
w.avail <- w.max - w.in
h.avail <- h.max - h.in
w.f <- sumUnitNull(w)
h.f <- sumUnitNull(h)
if(w.f/h.f > w.avail/h.avail) h.avail <- w.avail/w.f*h.f else w.avail <- h.avail/h.f*w.f
w <- w.in + w.avail
h <- h.in + h.avail
ggsave(filename, plot = plot, device = device, path = path, scale = scale,
width = w, height = h, units = units, dpi = dpi, limitsize = limitsize)
}
p <- ggplot(mpg, aes(displ, cty)) + geom_point() + coord_fixed(ratio=1)
p <- p + facet_grid(. ~ cyl)
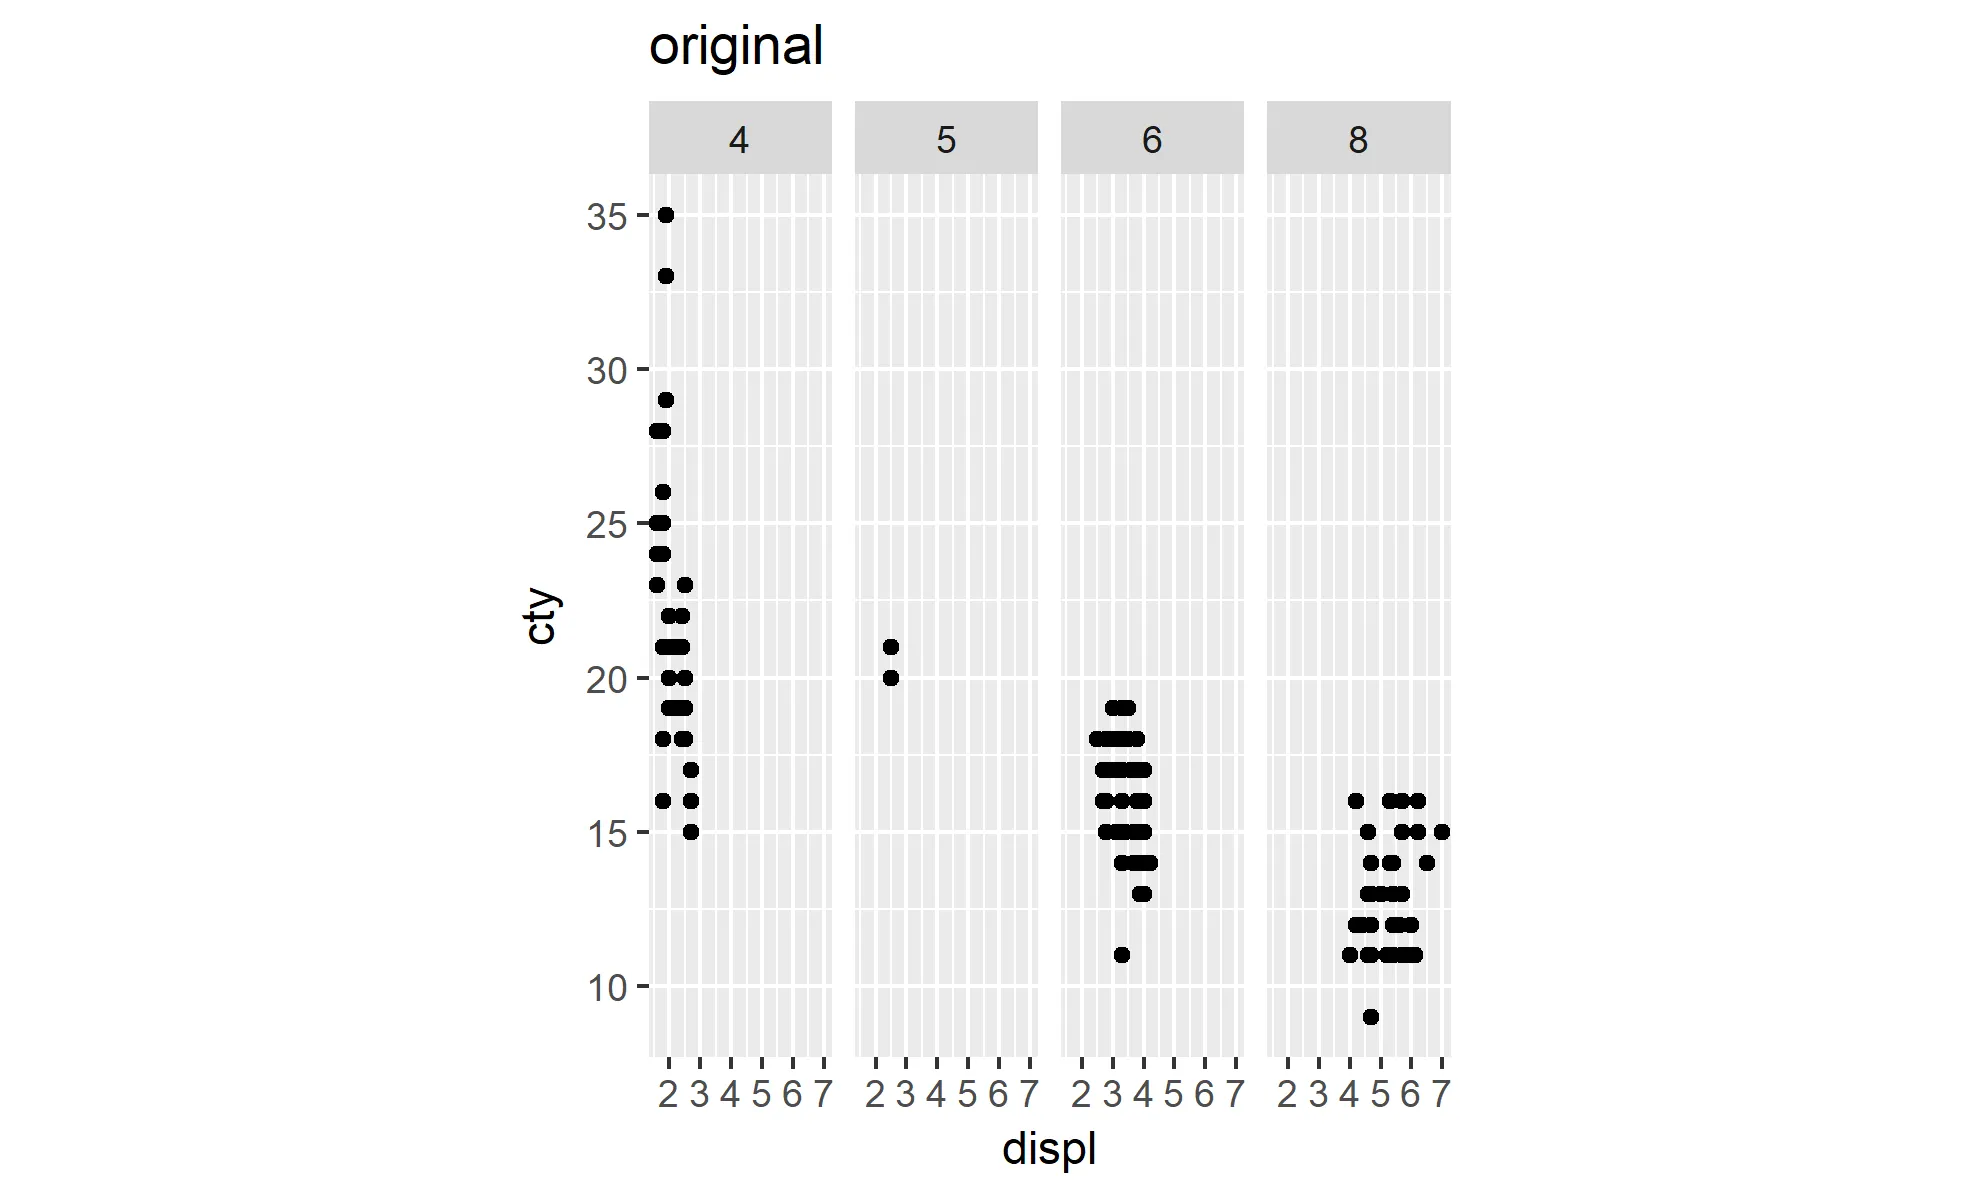
ggsave("pOriginal.png", p + ggtitle("original"))
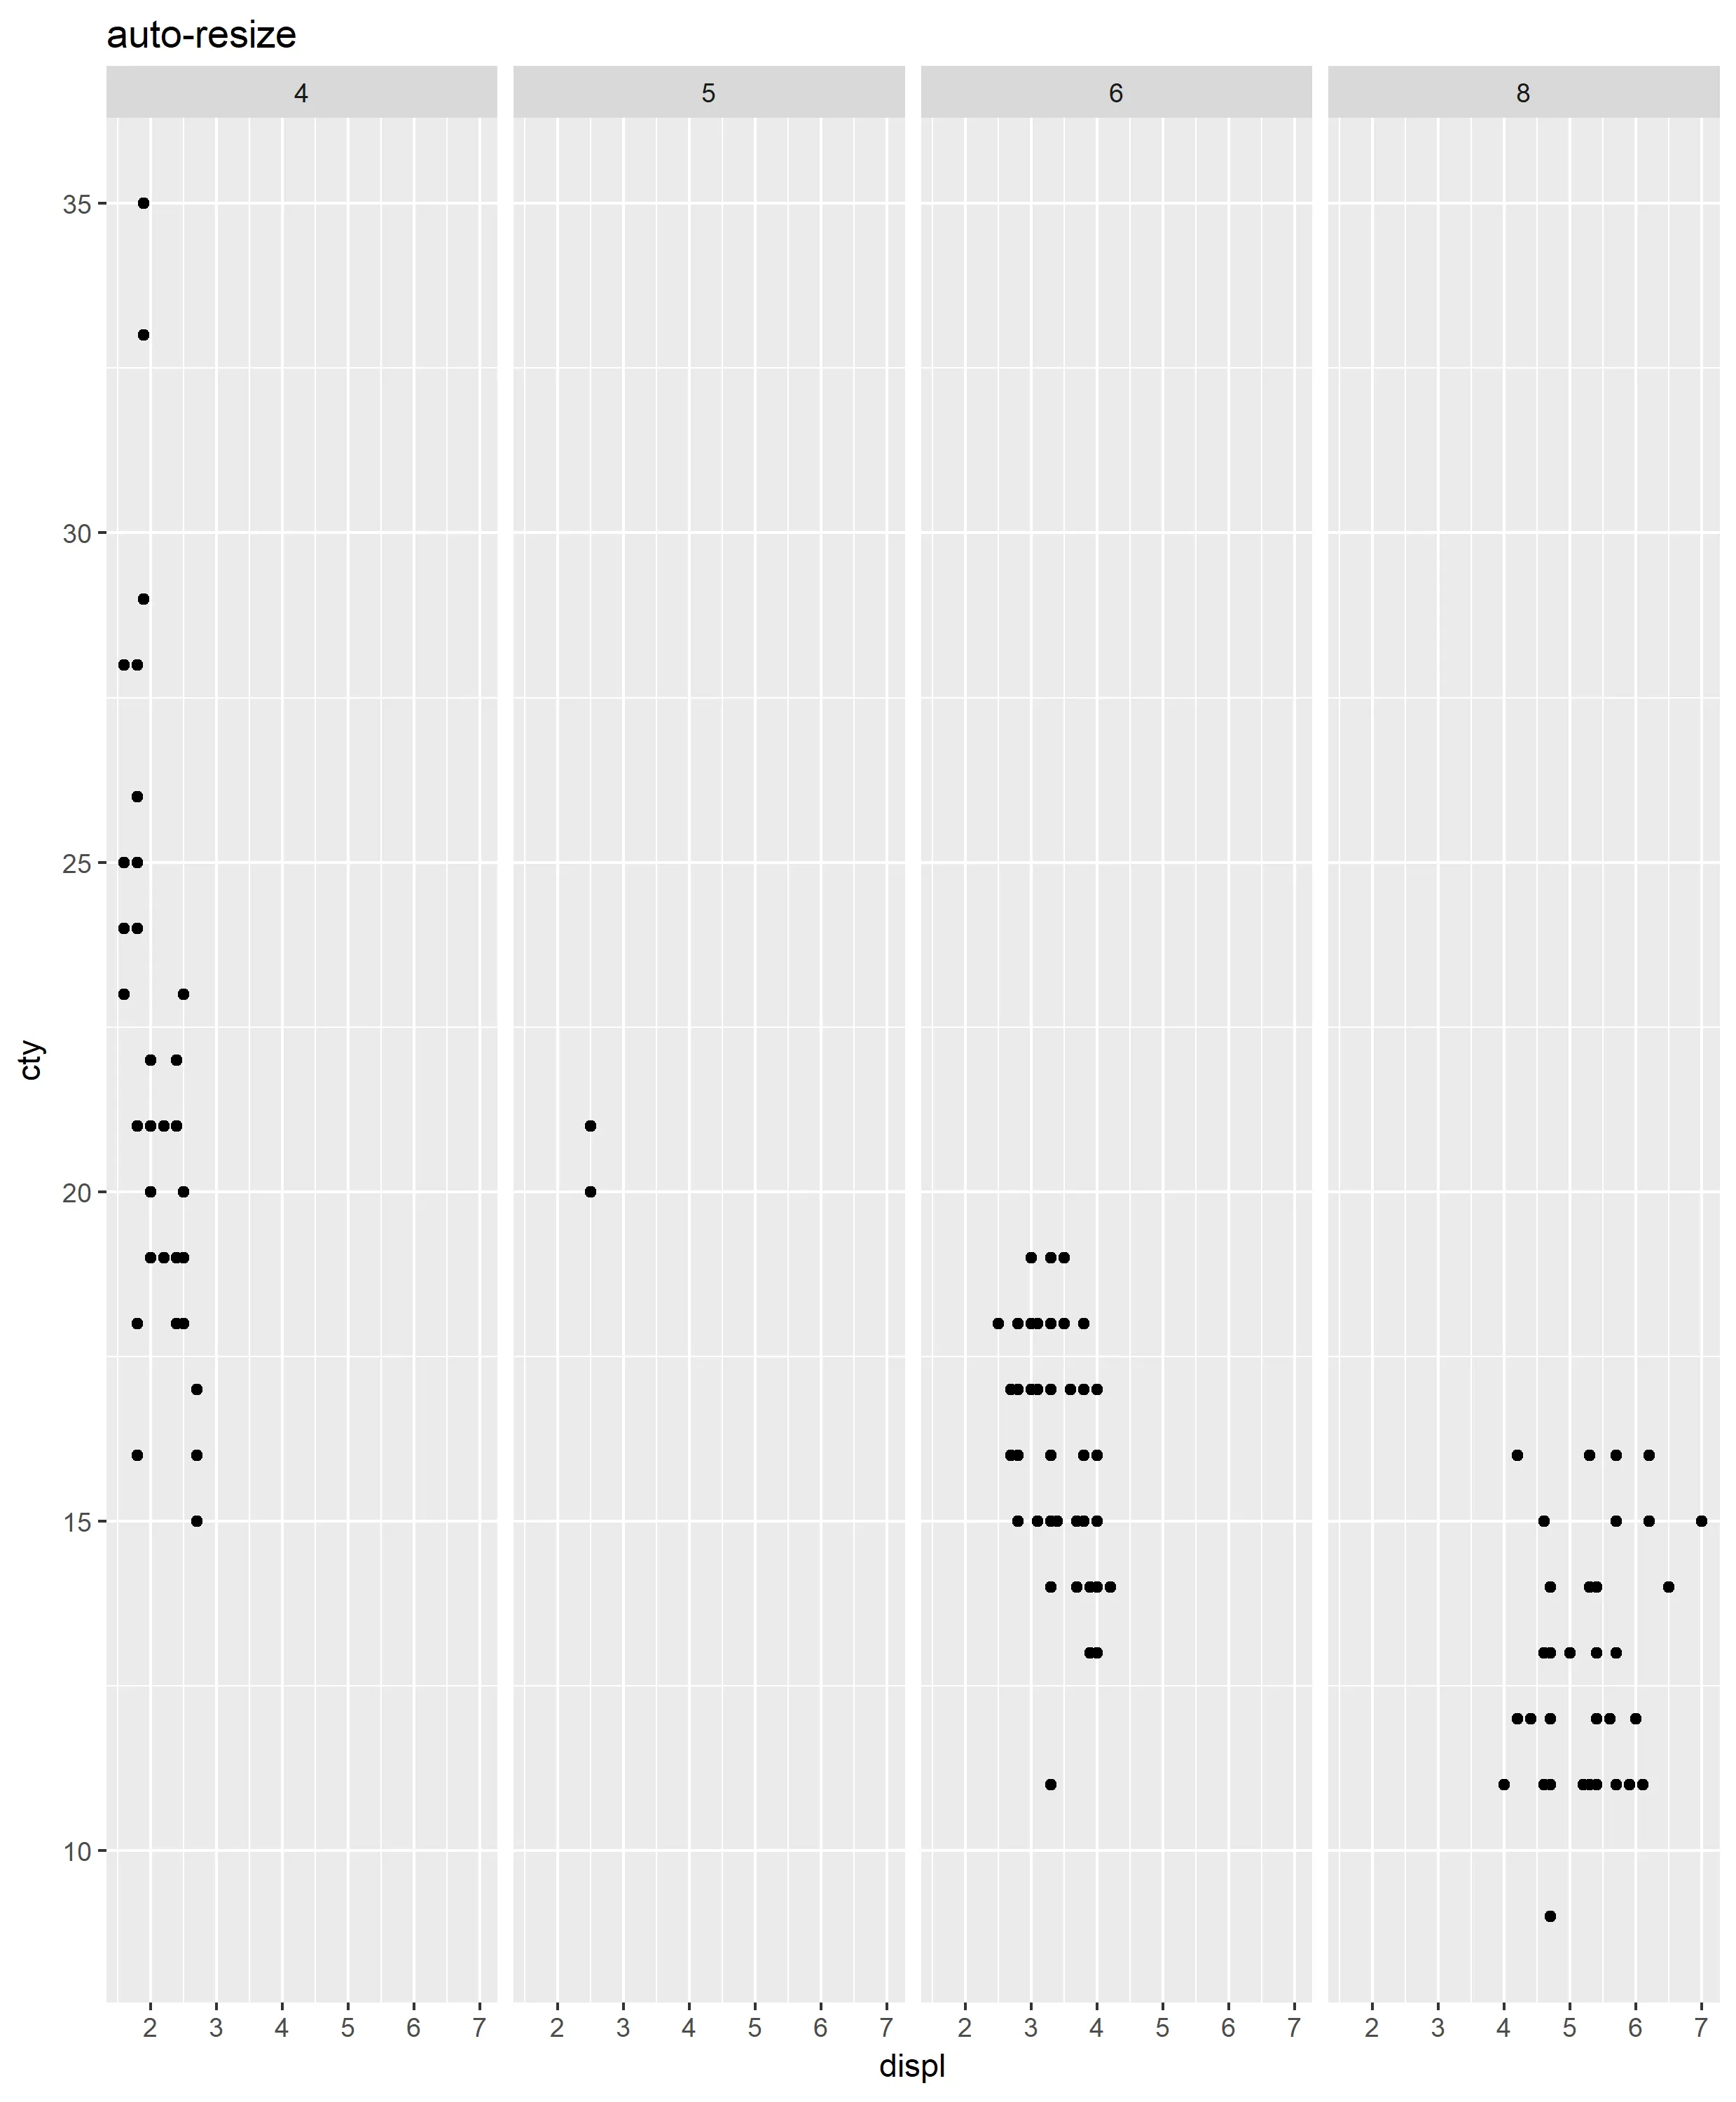
ggsave_autosize("pAutoSize.png", p + ggtitle("auto-resize"))
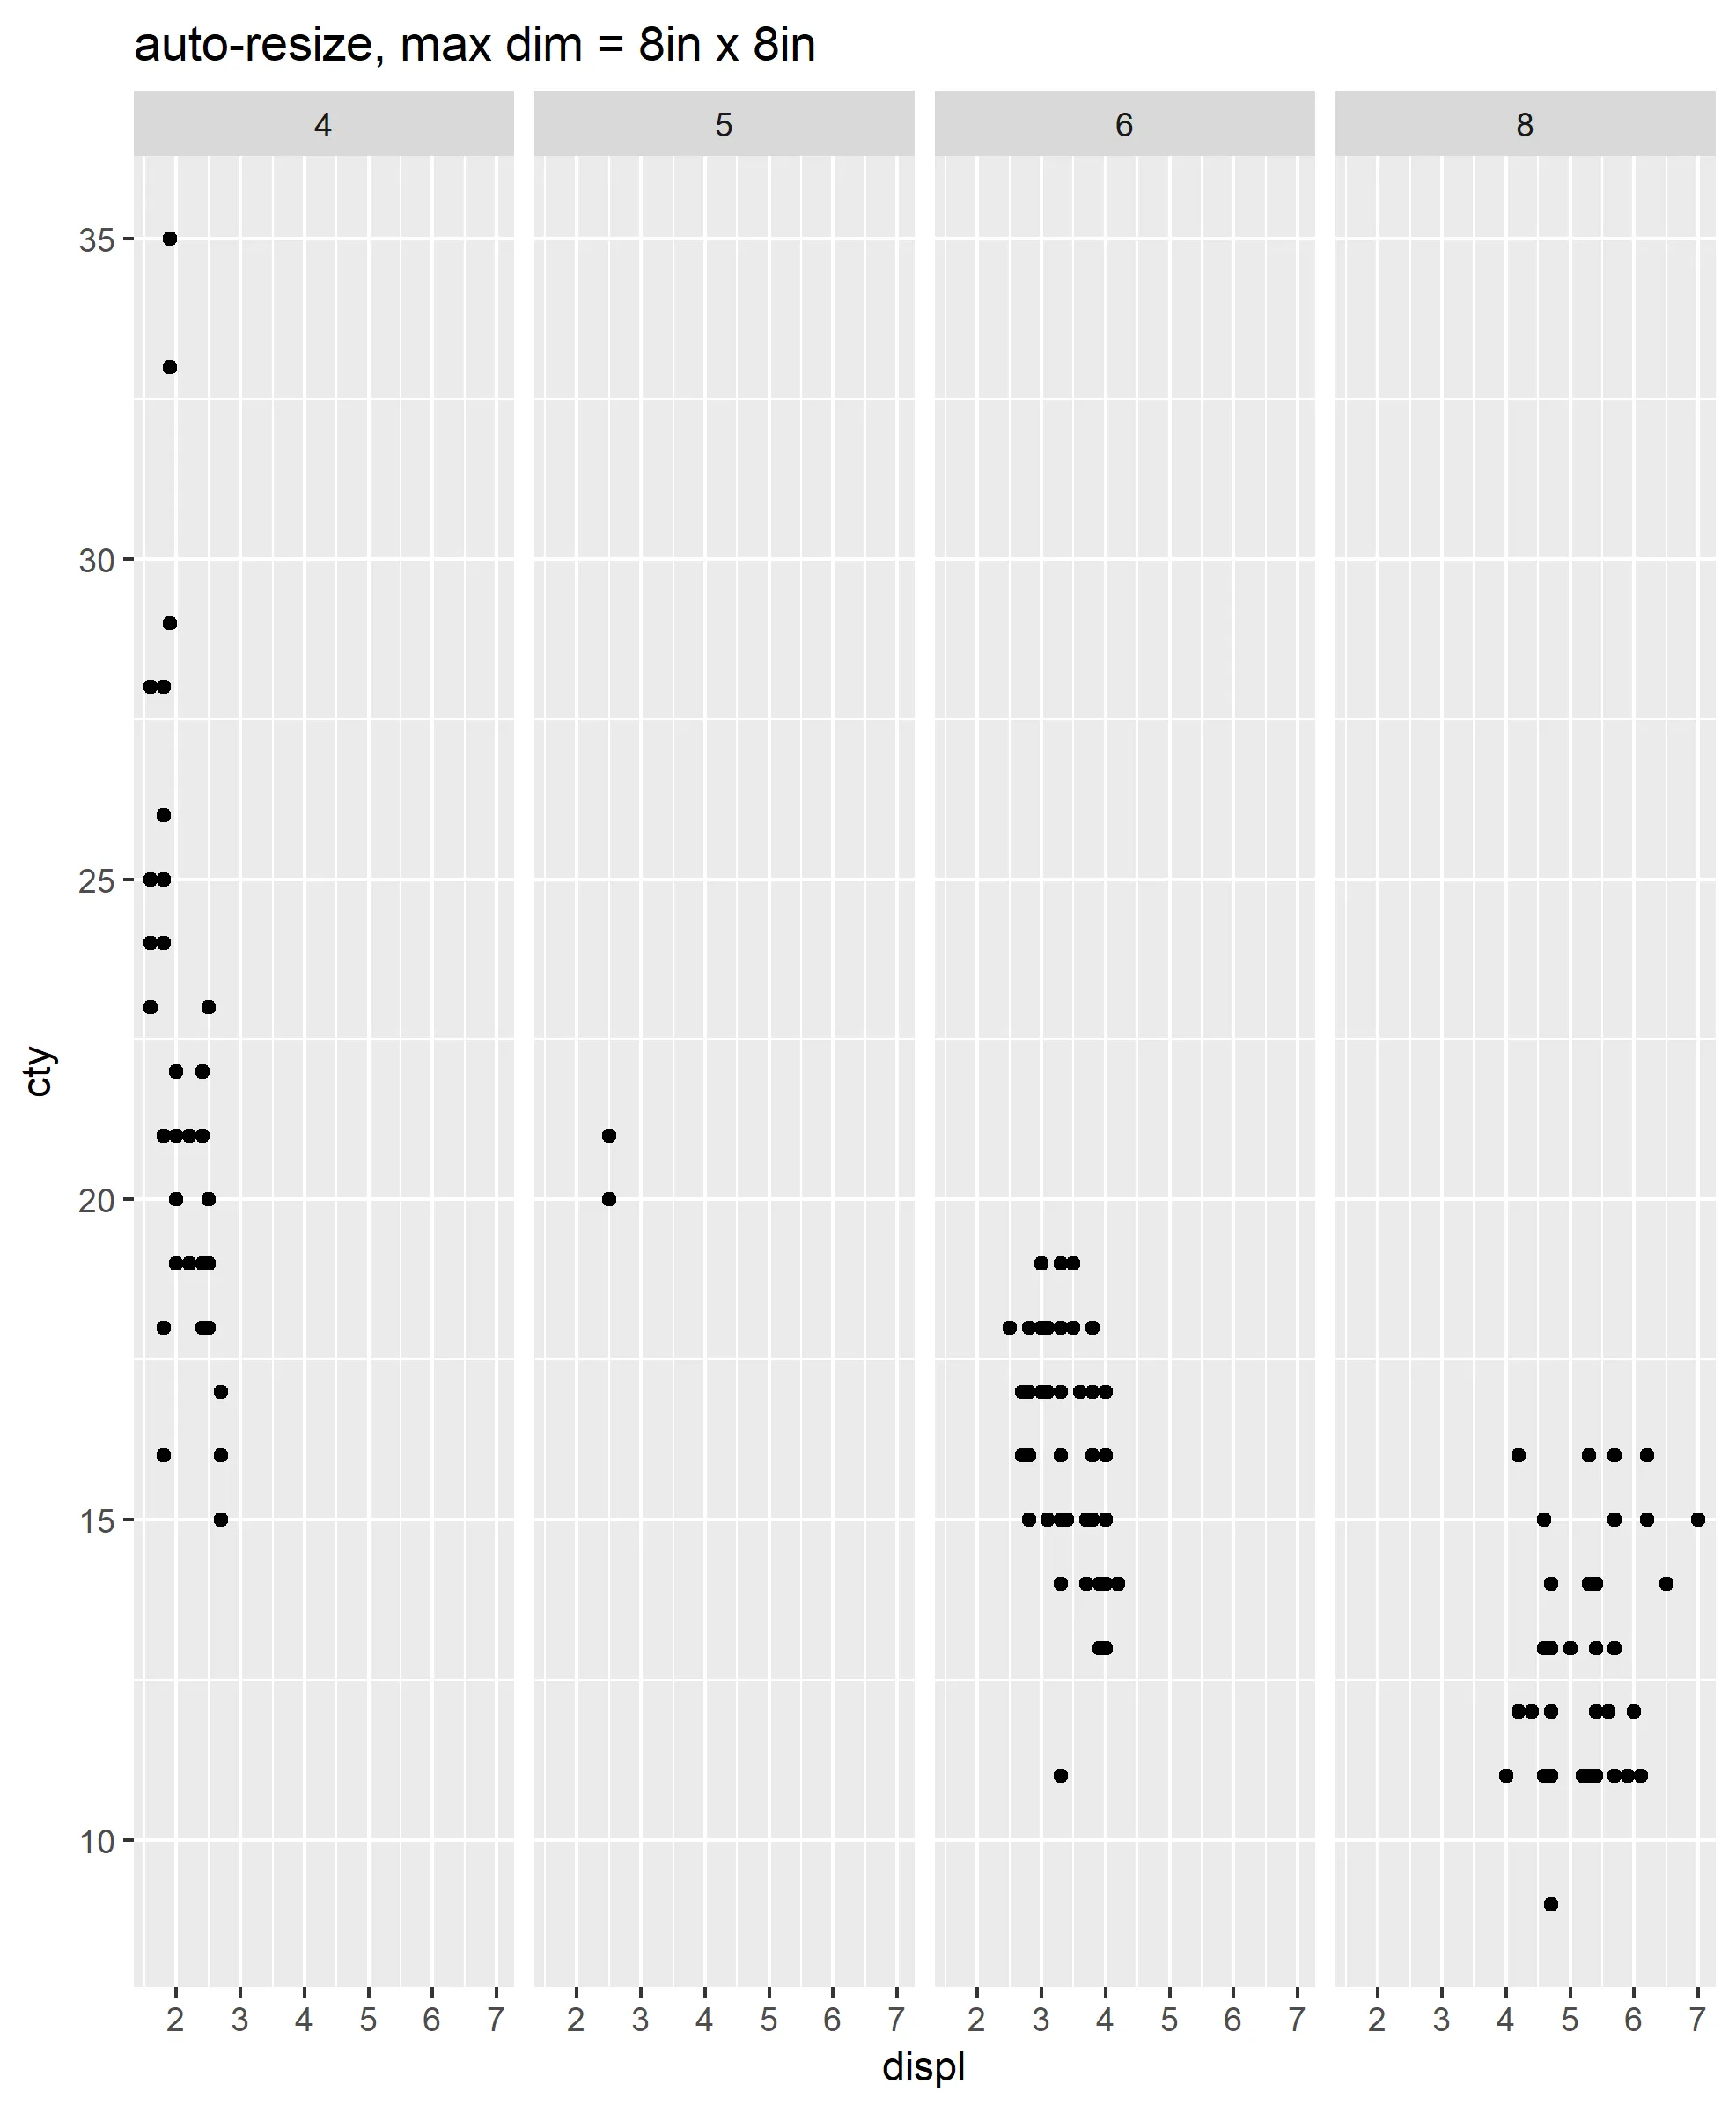
ggsave_autosize("pAutoSize8.png", p + ggtitle("auto-resize, max dim = 8in x 8in"), max.dimension = 8, units = "in")
原始版本未裁剪。左/右侧有黑色空间:
自动裁剪版本。高度=10英寸:
自动裁剪版本。高度=8英寸(因此字体看起来稍微大一些):