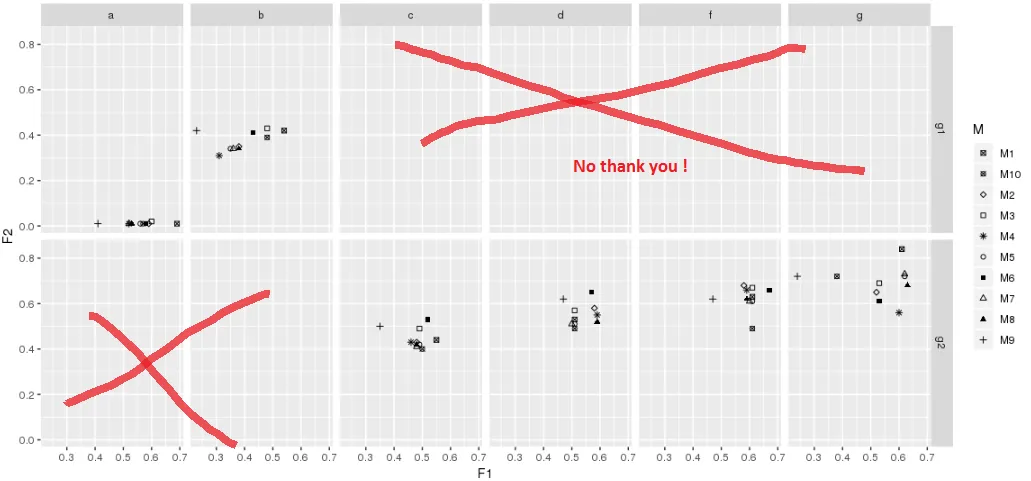
我正在使用 ggplot 的 facet_grid 来制作 geom_point,但是我得到了一个空的 facet,我不知道如何删除它们或者如何结构化我的数据以避免出现空的 facet?
这是我的数据示例:
我的代码:
我明白了: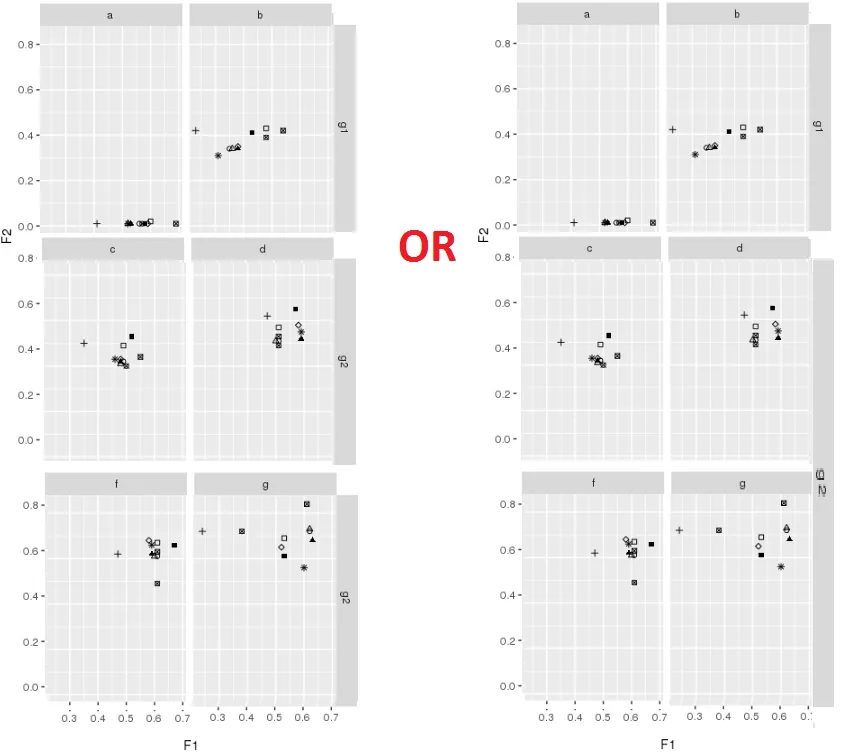
这是我的数据示例:
data = data.frame(
  F1=c(0.69, 0.59, 0.6 , 0.52, 0.56, 0.58, 0.52, 0.53, 0.41, 0.57,
       0.54, 0.38, 0.48, 0.31, 0.35,
       0.43, 0.36, 0.38, 0.23, 0.48, 0.55, 0.48, 0.49, 0.46, 0.49,
       0.52, 0.48, 0.48, 0.35, 0.5 ,
       0.51, 0.58, 0.51, 0.59, 0.51, 0.57, 0.5 , 0.59, 0.47, 0.51,
       0.61, 0.58, 0.61, 0.59, 0.61, 0.67, 0.6 , 0.59, 0.47, 0.61,
       0.61, 0.52, 0.53, 0.60,0.62, 0.53, 0.62, 0.63, 0.24, 0.38),
  F2 = c(0.01, 0.01, 0.02, 0.01, 0.01, 0.01, 0.01, 0.01, 0.01, 0.01,
         0.42, 0.35, 0.43, 0.31, 0.34, 0.41, 0.34, 0.34, 0.42, 0.39, 0.44, 0.43,
         0.49, 0.43, 0.42, 0.53, 0.41, 0.42, 0.50, 0.40 ,
         0.53, 0.58, 0.57, 0.55, 0.51, 0.65, 0.51, 0.52, 0.62, 0.49,
         0.63, 0.68, 0.67, 0.66, 0.61, 0.66, 0.61, 0.62, 0.62, 0.49,
         0.84, 0.65, 0.69, 0.56, 0.72, 0.61, 0.73, 0.68, 0.72, 0.72),
  s1= c(rep(c("a"),10),
        rep(c("b"),10),
        rep(c("c"),10),
        rep(c("d"),10),
        rep(c("f"),10),
        rep(c("g"),10)),
  s2= c(rep(c("g1"),20),
        rep(c("g2"),40)),
  M=rep(c("M1",
          "M2",
          "M3",
          "M4",
          "M5",
          "M6",
          "M7",
          "M8",
          "M9",
          "M10"),6))
我的代码:
ggplot (data, aes (x = F1, y = F2, shape = M)) +
  facet_grid(s2 ~ s1) + scale_shape_manual(values=c(7,13,23,0,8,1,15,2,17,3,25))+
  geom_point ()
我明白了:
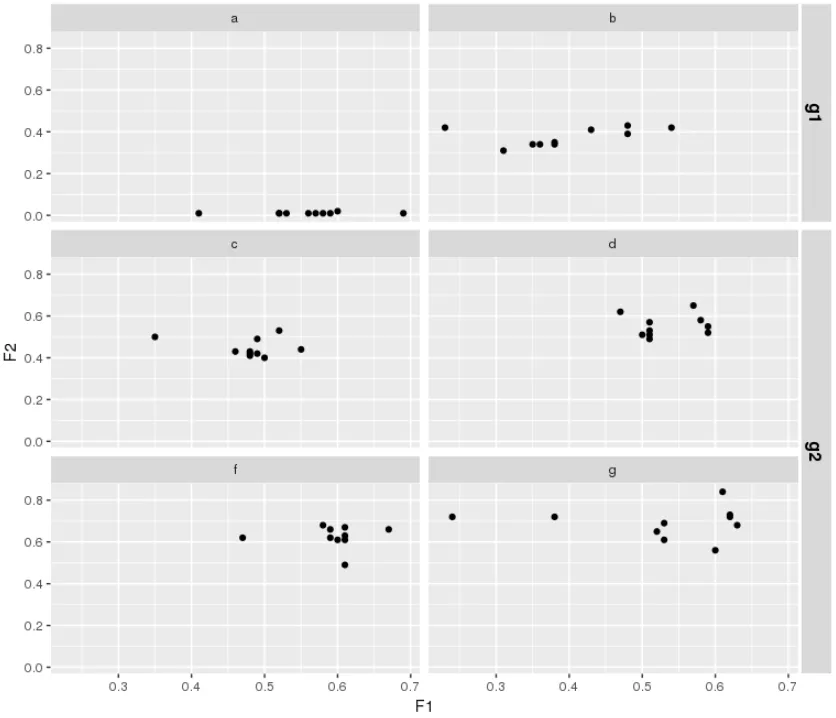


facet_wrap- A. Suliman