向ggplot分面添加自定义图片

12

我希望为每个分面添加自定义图片。使用 annotation_custom 会在所有分面中重复一个图片,例如:

require(ggplot2); require(grid); require(png); require(RCurl)

p = ggplot(iris, aes(Sepal.Length, Sepal.Width)) + geom_point() + facet_wrap(~Species)

img1 = readPNG(getURLContent('https://cdn2.iconfinder.com/data/icons/animals/48/Turtle.png'))
img2 = readPNG(getURLContent('https://cdn2.iconfinder.com/data/icons/animals/48/Elephant.png'))
img3 = readPNG(getURLContent('https://cdn2.iconfinder.com/data/icons/animals/48/Hippopotamus.png'))

a1 = annotation_custom(rasterGrob(img1, interpolate=TRUE), xmin=7, xmax=8, ymin=3.75, ymax=4.5)
a2 = annotation_custom(rasterGrob(img2, interpolate=TRUE), xmin=7, xmax=8, ymin=3.75, ymax=4.5)
a3 = annotation_custom(rasterGrob(img3, interpolate=TRUE), xmin=7, xmax=8, ymin=3.75, ymax=4.5)

p + a1

enter image description here

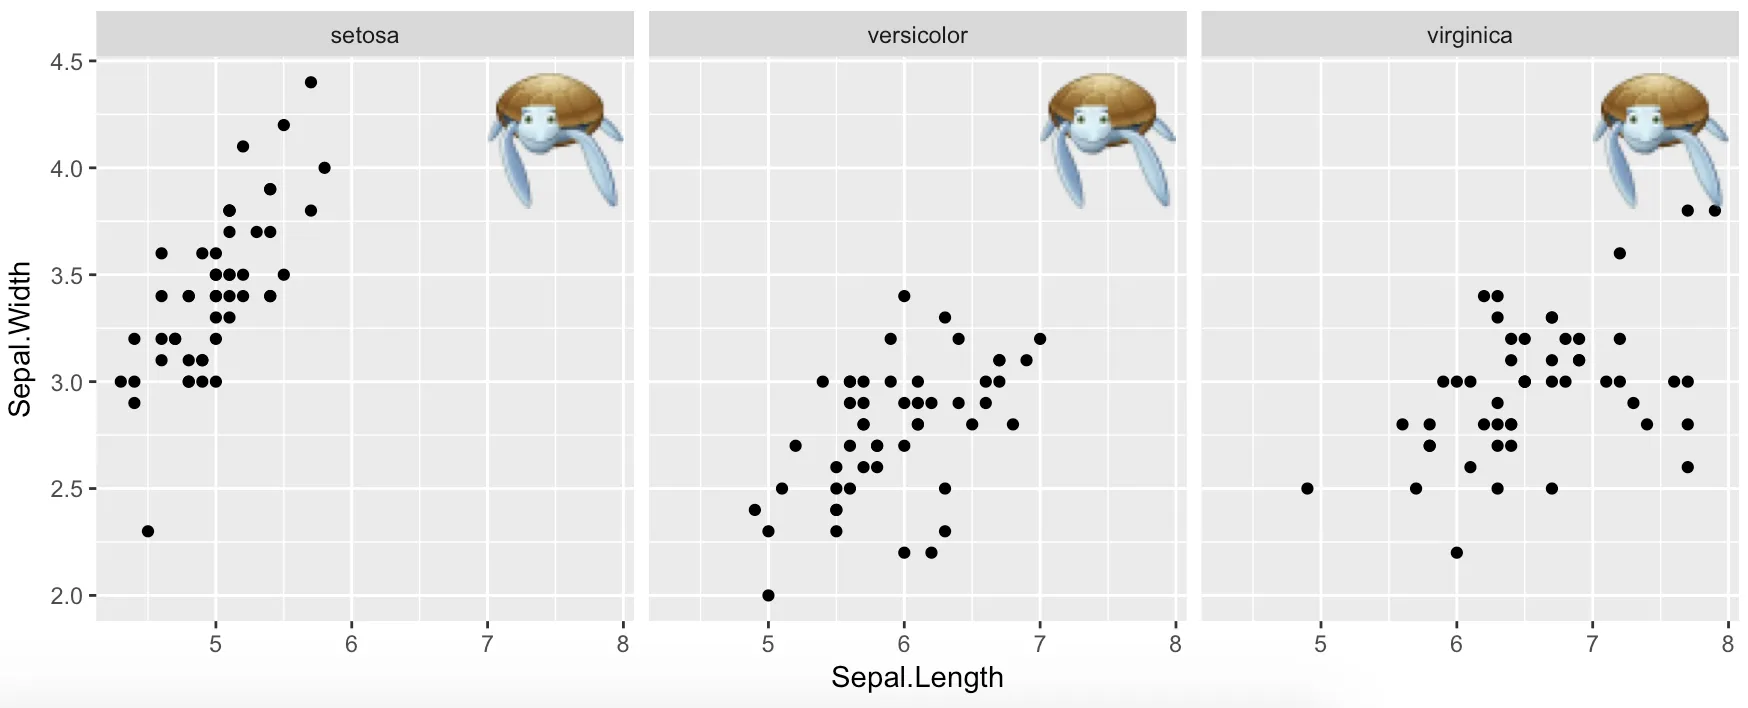
有没有其他方法可以实现这一点,使得img1-3正确地填充相应的面部特征?


1
您可以使用@baptiste的annotation_custom2函数。请参阅https://dev59.com/E4_ea4cB1Zd3GeqPPYfn?answertab = votes#tab-top - Edgar Santos
此外,这可能会有用 https://github.com/hrbrmstr/ggalt/issues/4 - Edgar Santos
@baptiste 的妙招,感谢提供链接。想要记录答案吗?我的代码是 a1 = annotation_custom2(rasterGrob(img1, interpolate=TRUE), xmin=7, xmax=8, ymin=3.75, ymax=4.5, data=iris[1,]) - geotheory
1个回答

12

为了全面性,我添加了答案。所有功劳归功于@baptiste提出的annotation_custom2函数。

require(ggplot2); require(grid); require(png); require(RCurl)

p = ggplot(iris, aes(Sepal.Length, Sepal.Width)) + geom_point() + facet_wrap(~Species)

img1 = readPNG(getURLContent('https://cdn2.iconfinder.com/data/icons/animals/48/Turtle.png'))
img2 = readPNG(getURLContent('https://cdn2.iconfinder.com/data/icons/animals/48/Elephant.png'))
img3 = readPNG(getURLContent('https://cdn2.iconfinder.com/data/icons/animals/48/Hippopotamus.png'))


annotation_custom2 <- 
function (grob, xmin = -Inf, xmax = Inf, ymin = -Inf, ymax = Inf, data){ layer(data = data, stat = StatIdentity, position = PositionIdentity, 
        geom = ggplot2:::GeomCustomAnn,
        inherit.aes = TRUE, params = list(grob = grob, 
                                          xmin = xmin, xmax = xmax, 
                                          ymin = ymin, ymax = ymax))}

a1 = annotation_custom2(rasterGrob(img1, interpolate=TRUE), xmin=7, xmax=8, ymin=3.75, ymax=4.5, data=iris[1,])
a2 = annotation_custom2(rasterGrob(img2, interpolate=TRUE), xmin=7, xmax=8, ymin=3.75, ymax=4.5, data=iris[51,])
a3 = annotation_custom2(rasterGrob(img3, interpolate=TRUE), xmin=7, xmax=8, ymin=3.75, ymax=4.5, data=iris[101,])

p + a1 + a2 + a3

输出:

在此输入图片描述


@ed_sans和baptiste,当使用scale_x_reverse()或scale_x_continuous(trans = "reverse")时,这个解决方案不起作用。图像就是不显示。有没有修复方法? - Roger

网页内容由stack overflow 提供, 点击上面的
可以查看英文原文,
原文链接