ggplot - 查找分面间距的坐标

3

我有如下图表:

library(ggplot2)
dat = data.frame(x = rnorm(100), y = rexp(100), grp = factor(sample(1:2, 100, replace = TRUE)))
ggplot(dat, aes(x = x, y = y, color = grp)) + 
  geom_point() + 
  facet_wrap(~grp) +
  theme(panel.spacing = unit(2, "lines"))

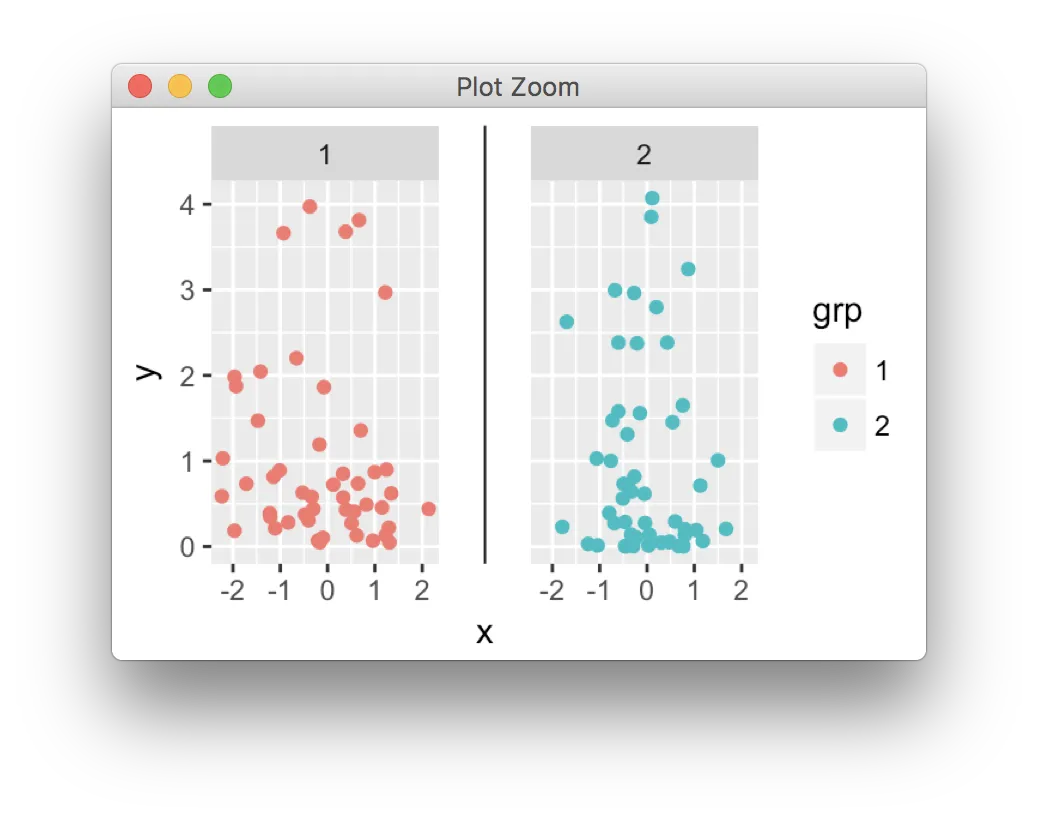
我想在两个图之间添加一条竖直线 - 也就是在面板间距的中间。我的问题是,我不确定如何获取内部绘图边缘/面板间距的原生单位坐标。

这两个面板都有0.5 npc的单位 -- 我不确定该如何转换。我尝试使用视口,但那行不通。除了安排第一个图 - 竖直线的绘制 - 第二个图的方法,是否还有其他的方法?

2个回答

1

这符合您的意图吗?您可以调整参数以更改线条出现的位置。

# loading the libraries
library(ggplot2)
library(grid)
library(cowplot)

# preparing the data
dat = data.frame(x = rnorm(100),
                 y = rexp(100),
                 grp = factor(sample(1:2, 100, replace = TRUE)))

# preparing the plot
plot <- ggplot(dat, aes(x = x, y = y, color = grp)) +
  geom_point() + 
  facet_wrap( ~ grp) +
  theme(panel.spacing = unit(2, "lines"))

# preparing the line
gline <- grid::linesGrob(x = 0.5)

# plotting both the plot and the line
cowplot::ggdraw() +
  cowplot::draw_plot(plot) +
  cowplot::draw_plot(gline) 

这段内容是在2018年1月24日使用reprex包(v0.1.1.9000)创建的。


是的,基本上没错。不过,我更愿意找到精确的坐标,这样它就可以在正中间了 :) - eok

0
library(grid)
library(gtable)
library(magrittr)

ggplotGrob(p) %>%
  gtable_add_grob(segmentsGrob(0.5, 0, 0.5, 1), 
                  t = 4, b = 8, l = 7, r = 7)  %>%
  grid.draw()

在此输入图片描述


1
感谢您提供这段代码片段,它可能会在短期内提供一些有限的帮助。通过展示为什么这是一个好的解决方案,适当的解释将极大地提高其长期价值,并使其对未来有类似问题的读者更有用。请编辑您的答案以添加一些解释,包括您所做的假设。 - Shawn C.
理论上是可以的,但是1)我想在两个面的正中间添加垂直线,2)你是如何获取这些坐标的? - eok

网页内容由stack overflow 提供, 点击上面的
可以查看英文原文,
原文链接