使用Networkx绘制相似性矩阵

3

我正在尝试使用networkx可视化单词之间的相关性(相似度得分高达1)

例如,狗、猫、动物、人、狼之间的相似性得分

我已经尝试使用以下代码绘制每个单词/节点之间的相似性距离

import networkx as nx
import matplotlib.pyplot as plt
G=nx.Graph()

corr_data =([['Dog', 'Dog', 1.0],
       ['Cat', 'Dog', 0.8016854524612427],
       ['Wolf', 'Dog', 0.5206573009490967],
       ['Person', 'Dog', 0.3756750822067261],
       ['Animal', 'Dog', 0.6618534326553345],
       ['Cat', 'Cat', 1.0],
       ['Wolf', 'Cat', 0.5081626176834106],
       ['Person', 'Cat', 0.32475101947784424],
       ['Animal', 'Cat', 0.6260400414466858],
       ['Wolf', 'Wolf', 1.0],
       ['Person', 'Wolf', 0.23091702163219452],
       ['Animal', 'Wolf', 0.5261368751525879],
       ['Person', 'Person', 1.0],
       ['Animal', 'Person', 0.34220656752586365],
       ['Animal', 'Animal', 1.0]])

existing_edges = {}

def build_graph(w, lev):
  if (lev > 5)  :
      return
  for z in corr_data:
     ind=-1 
     if z[0] == w:
         ind=0
         ind1=1
     if z[1] == w:
         ind ==1
         ind1 =0

     if ind == 0 or ind == 1:
         if  str(w) + "_" + str(corr_data[ind1]) not in existing_edges :

             G.add_node(str(corr_data[ind]))
             existing_edges[str(w) + "_" + str(corr_data[ind1])] = 1;
             G.add_edge(w,str(corr_data[ind1]))

             build_graph(corr_data[ind1], lev+1)


existing_nodes = {}
def build_graph_for_all():
    count=0
    for d in corr_data:
        if (count > 40) :
            return
        if  d[0] not in existing_edges :
             G.add_node(str(d[0]))
        if  d[1] not in existing_edges :     
             G.add_node(str(d[1]))
        G.add_edge(str(d[0]), str(d[1]))     
        count=count + 1


build_graph_for_all()

print (G.nodes(data=True))
plt.show()
nx.draw(G, width=2, with_labels=True)
plt.savefig("path1.png")


w="design"
G.add_node(w)
build_graph(w, 0)

print (G.nodes(data=True))
plt.show()
nx.draw(G, width=2, with_labels=True)
plt.savefig("path.png")

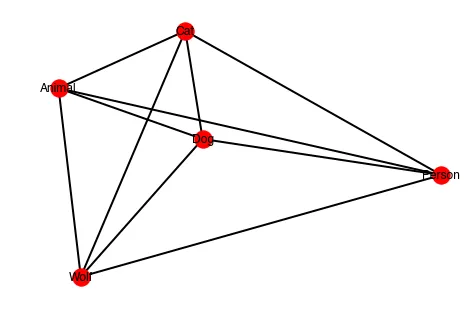
我的节点之间的距离似乎出现了问题,例如猫和人的距离比猫和狗的距离更近。我是否忽略了明显的问题?
1个回答

2
有几个问题需要解决。最重要的是,你需要了解如何使用弹簧布局绘制网络,具体可以参考这里。基本上,你需要将相关值添加到网络边缘。"Original Answer"的意思是"最初的回答"。
  1. You can do this by replacing your G.add_edge line in build_graph_for_all by:

     G.add_weighted_edges_from([[str(d[0]), str(d[1]),d[2]]])     
    
  2. You can plot your network using the following code, which should take the edge weights into account.

    pos = nx.spring_layout(G,weight='weight')
    nx.draw(G,pos=pos, width=2, with_labels=True)
    
  3. If you really want to emphasize the different between high and low correlation edges, you can transform the weights as follows:

    corr_data = [[x[0],x[1],1000**(x[2])] for x in corr_data]
    
这将拉伸您的权重 - 低相关性(.3)将映射到约1000 ^ 0.3 ≈ 8,而完美的相关性(1)将映射到1000。使用这些新权重重新制作图表并重复上面的绘图代码可得到以下图像:result of the plot 这是完整的工作代码。请注意保留HTML标签。"最初的回答"
import networkx as nx
import matplotlib.pyplot as plt

G=nx.Graph()

corr_data =([['Dog', 'Dog', 1.0],
       ['Cat', 'Dog', 0.8016854524612427],
       ['Wolf', 'Dog', 0.5206573009490967],
       ['Person', 'Dog', 0.3756750822067261],
       ['Animal', 'Dog', 0.6618534326553345],
       ['Cat', 'Cat', 1.0],
       ['Wolf', 'Cat', 0.5081626176834106],
       ['Person', 'Cat', 0.32475101947784424],
       ['Animal', 'Cat', 0.6260400414466858],
       ['Wolf', 'Wolf', 1.0],
       ['Person', 'Wolf', 0.23091702163219452],
       ['Animal', 'Wolf', 0.5261368751525879],
       ['Person', 'Person', 1.0],
       ['Animal', 'Person', 0.34220656752586365],
       ['Animal', 'Animal', 1.0]])

corr_data = [[x[0],x[1],1000**(x[2])] for x in corr_data]

existing_edges = {}
def build_graph(w, lev):
  if (lev > 5)  :
      return
  for z in corr_data:
     ind=-1 
     if z[0] == w:
         ind=0
         ind1=1
     if z[1] == w:
         ind ==1
         ind1 =0
     if ind == 0 or ind == 1:
         if  str(w) + "_" + str(corr_data[ind1]) not in existing_edges :
             G.add_node(str(corr_data[ind]))
             existing_edges[str(w) + "_" + str(corr_data[ind1])] = 1;
             G.add_edge(w,str(corr_data[ind1]))
             build_graph(corr_data[ind1], lev+1)

existing_nodes = {}
def build_graph_for_all():
    count=0
    for d in corr_data:
        if (count > 40) :
            return
        if  d[0] not in existing_edges :
             G.add_node(str(d[0]))
        if  d[1] not in existing_edges :     
             G.add_node(str(d[1]))
        G.add_weighted_edges_from([[str(d[0]), str(d[1]),d[2]]])     
        count=count + 1

build_graph_for_all()

pos = nx.spring_layout(G,weight='weight')
nx.draw(G,pos=pos, width=2, with_labels=True)

plt.savefig("path1.png")

1
你能否在原回答中编辑您的完整代码,它在逻辑上是正确的,但我很难复制它。 - BadKarma1122

网页内容由stack overflow 提供, 点击上面的
可以查看英文原文,
原文链接