1个回答
51
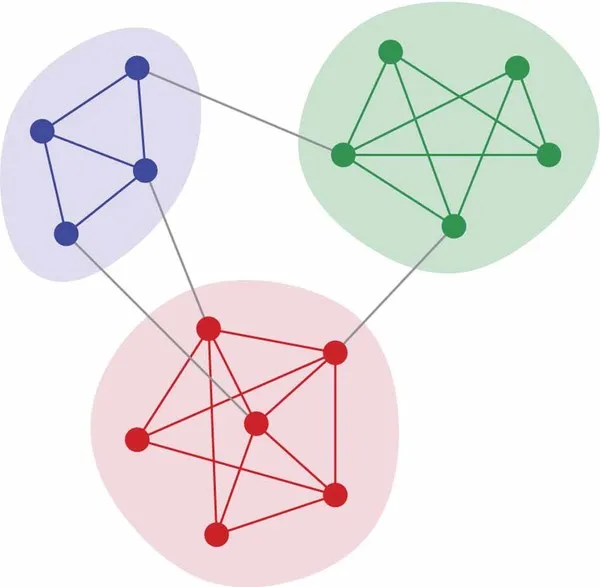
networkx.draw_networkx_nodes和networkx.draw_networkx_edges的文档说明了如何设置节点和边的颜色。创建社区的边界补丁可以通过找到每个社区的节点位置,然后绘制一个包含所有位置(以及更多位置)的补丁(例如matplotlib.patches.Circle)来实现。
困难的部分是图形布局/设置节点位置。据我所知,在networkx中没有一种例行程序能够“开箱即用”地实现期望的图形布局。你想要做的是以下几点:
将社区与彼此相关联的位置:创建一个新的加权图,其中每个节点对应于一个社区,权值对应于社区之间的边数。使用你喜欢的图形布局算法(例如
spring_layout)得到一个合理的布局。在每个社区内定位节点:为每个社区创建一个新的图形。找到子图的位置布局。
结合1)和3)中的节点位置。例如,通过因子10缩放在1)中计算出的社区位置;将这些值添加到该社区内所有节点(如在2)中计算的)的位置。
我一直想实现这个功能。我可能会在今天晚些时候或周末做这件事。
编辑:
完成了。现在你只需要在节点的周围(后面)绘制你喜爱的图形补丁即可。
import numpy as np
import matplotlib.pyplot as plt
import networkx as nx
def community_layout(g, partition):
"""
Compute the layout for a modular graph.
Arguments:
----------
g -- networkx.Graph or networkx.DiGraph instance
graph to plot
partition -- dict mapping int node -> int community
graph partitions
Returns:
--------
pos -- dict mapping int node -> (float x, float y)
node positions
"""
pos_communities = _position_communities(g, partition, scale=3.)
pos_nodes = _position_nodes(g, partition, scale=1.)
# combine positions
pos = dict()
for node in g.nodes():
pos[node] = pos_communities[node] + pos_nodes[node]
return pos
def _position_communities(g, partition, **kwargs):
# create a weighted graph, in which each node corresponds to a community,
# and each edge weight to the number of edges between communities
between_community_edges = _find_between_community_edges(g, partition)
communities = set(partition.values())
hypergraph = nx.DiGraph()
hypergraph.add_nodes_from(communities)
for (ci, cj), edges in between_community_edges.items():
hypergraph.add_edge(ci, cj, weight=len(edges))
# find layout for communities
pos_communities = nx.spring_layout(hypergraph, **kwargs)
# set node positions to position of community
pos = dict()
for node, community in partition.items():
pos[node] = pos_communities[community]
return pos
def _find_between_community_edges(g, partition):
edges = dict()
for (ni, nj) in g.edges():
ci = partition[ni]
cj = partition[nj]
if ci != cj:
try:
edges[(ci, cj)] += [(ni, nj)]
except KeyError:
edges[(ci, cj)] = [(ni, nj)]
return edges
def _position_nodes(g, partition, **kwargs):
"""
Positions nodes within communities.
"""
communities = dict()
for node, community in partition.items():
try:
communities[community] += [node]
except KeyError:
communities[community] = [node]
pos = dict()
for ci, nodes in communities.items():
subgraph = g.subgraph(nodes)
pos_subgraph = nx.spring_layout(subgraph, **kwargs)
pos.update(pos_subgraph)
return pos
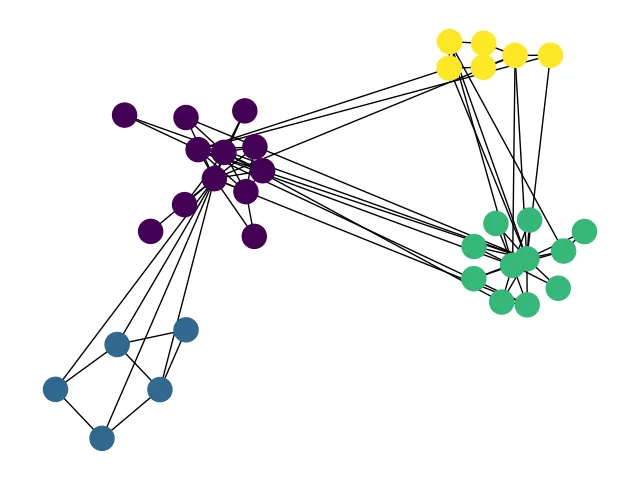
def test():
# to install networkx 2.0 compatible version of python-louvain use:
# pip install -U git+https://github.com/taynaud/python-louvain.git@networkx2
from community import community_louvain
g = nx.karate_club_graph()
partition = community_louvain.best_partition(g)
pos = community_layout(g, partition)
nx.draw(g, pos, node_color=list(partition.values())); plt.show()
return
补充
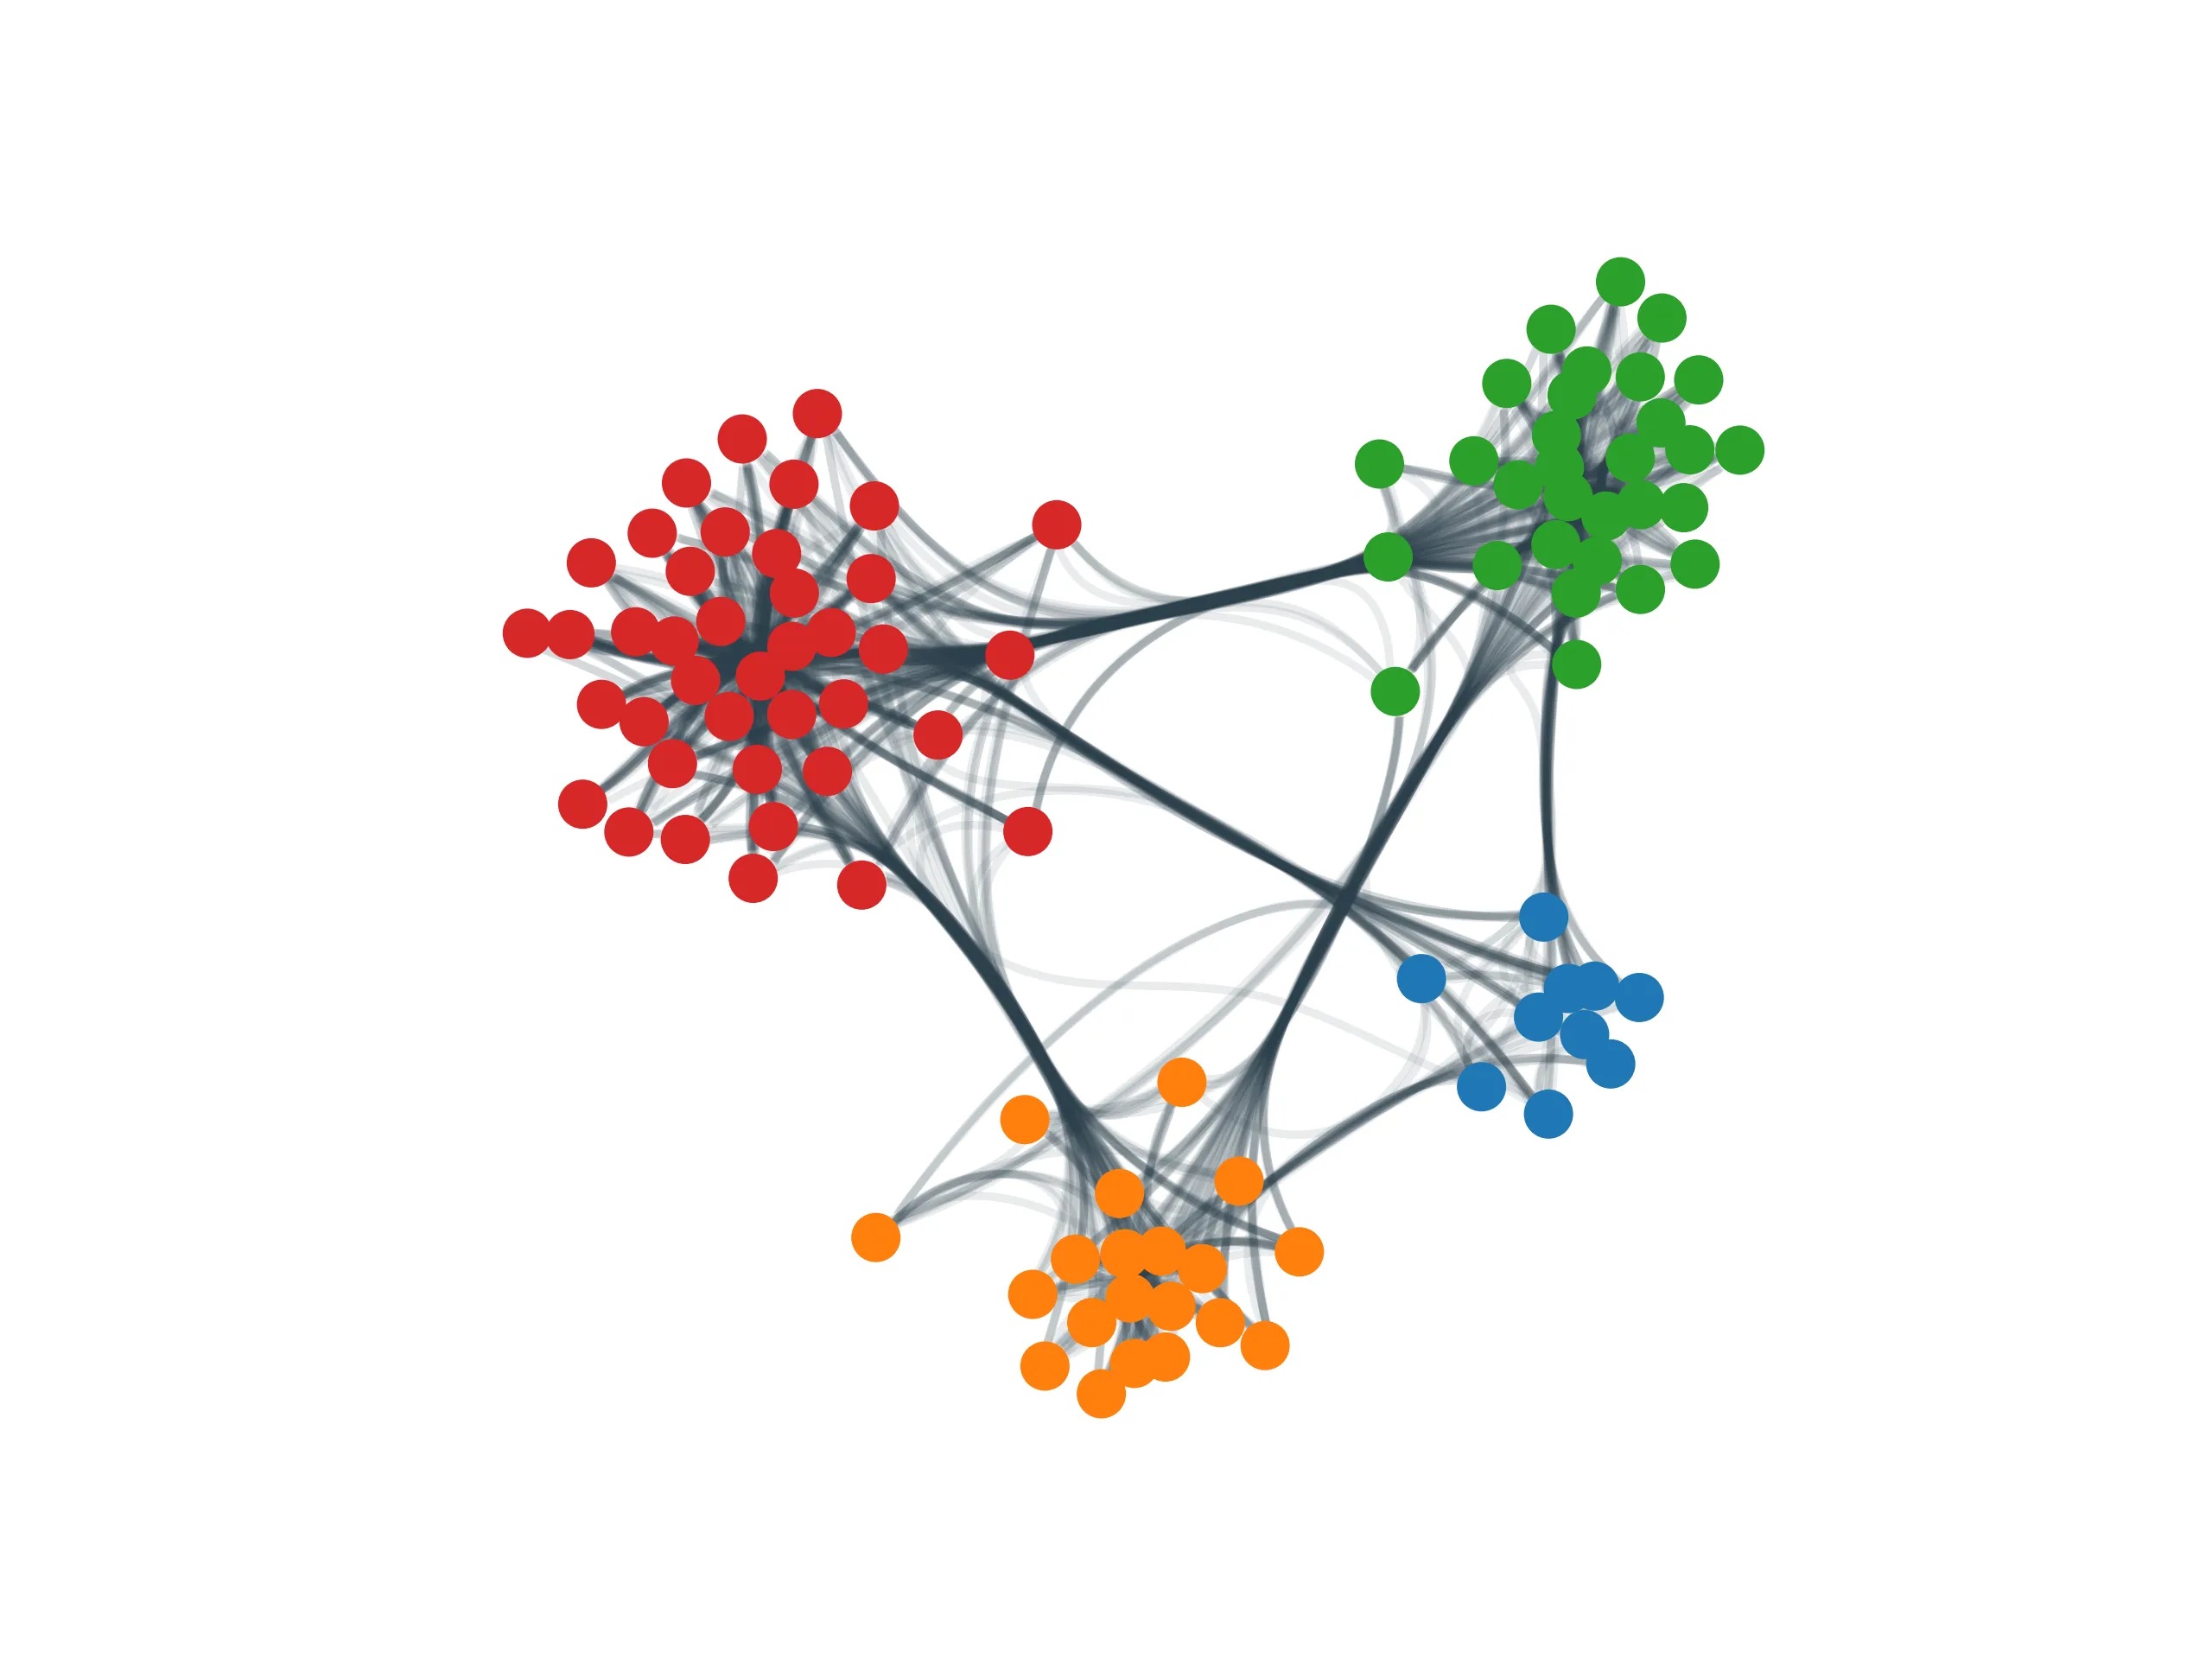
虽然这个想法本身是可行的,但我之前的实现存在一些问题。最重要的是,该实现对于大小不均的社区效果不佳。具体来说,_position_communities 在画布上为每个社区分配相同的空间。如果某些社区比其他社区大得多,这些社区就会被压缩到与小社区相同的空间中。显然,这并不很好地反映了图的结构。
我编写了一个名为NetGraph的网络可视化库。它包含了一个改进后的社区布局程序,考虑到社区的大小进行排列。它完全兼容networkx和igraph图对象,因此制作出漂亮的图形应该轻松快捷(至少这是我们的设想)。
import matplotlib.pyplot as plt
import networkx as nx

# installation easiest via pip:
# pip install netgraph
from netgraph import Graph

# create a modular graph
partition_sizes = [10, 20, 30, 40]
g = nx.random_partition_graph(partition_sizes, 0.5, 0.1)

# since we created the graph, we know the best partition:
node_to_community = dict()
node = 0
for community_id, size in enumerate(partition_sizes):
    for _ in range(size):
        node_to_community[node] = community_id
        node += 1

# # alternatively, we can infer the best partition using Louvain:
# from community import community_louvain
# node_to_community = community_louvain.best_partition(g)

community_to_color = {
    0 : 'tab:blue',
    1 : 'tab:orange',
    2 : 'tab:green',
    3 : 'tab:red',
}
node_color = {node: community_to_color[community_id] for node, community_id in node_to_community.items()}

Graph(g,
      node_color=node_color, node_edge_width=0, edge_alpha=0.1,
      node_layout='community', node_layout_kwargs=dict(node_to_community=node_to_community),
      edge_layout='bundled', edge_layout_kwargs=dict(k=2000),
)

plt.show()
- Paul Brodersen
5
网页内容由stack overflow 提供, 点击上面的可以查看英文原文,
原文链接
原文链接
nx.draw(g, pos, node_color=list(partition.values()))。 - Morteza Shahriari Niapartition的类型。已经更正。 - Paul Brodersennetgraph包(出现了一些关于维度的错误),但是我使用了你的community_layout代码,它非常好用。谢谢! - pegah