在Basemap上使用NetworkX绘制图形

16

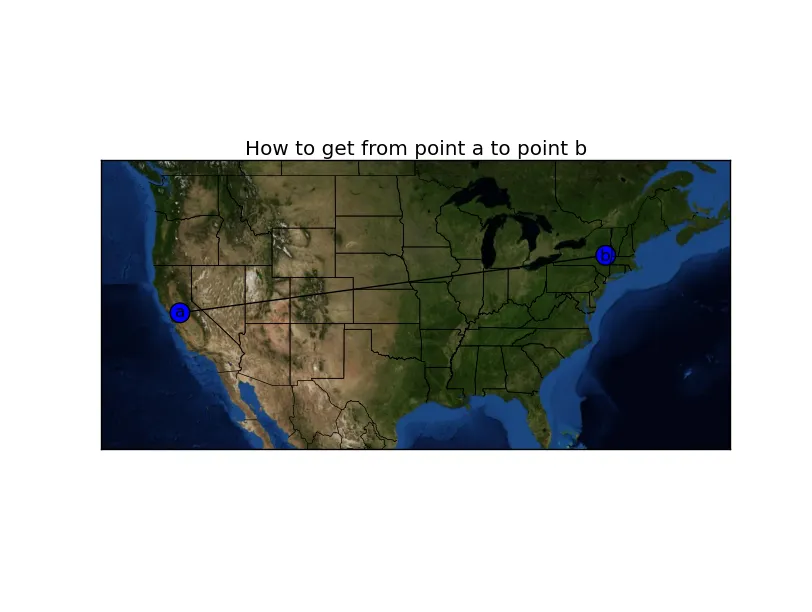
我想在地图上绘制一个图形,其中节点由坐标(lat,long)定义,并且具有一些关联值。

我已经能够将点作为散点图绘制在基础地图上,但似乎找不到如何在地图上绘制图形的方法。

谢谢。

编辑:我已经添加了关于如何在基础地图上绘制点的代码。大部分代码都是从这篇文章中适应过来的。

from mpl_toolkits.basemap import Basemap
from shapely.geometry import Point, MultiPoint
import pandas as pd
import matplotlib.pyplot as plt

m = Basemap(
        projection='merc',
        ellps = 'WGS84',
        llcrnrlon=-130,
        llcrnrlat=25,
        urcrnrlon=-60,
        urcrnrlat=50,
        lat_ts=0,
        resolution='i',
        suppress_ticks=True)

# Create Point objects in map coordinates from dataframe lon
# and lat values
# I have a dataframe of coordinates
map_points = pd.Series(
                [Point(m(mapped_x, mapped_y)) 
                 for mapped_x, mapped_y in zip(df['lon'],
                                               df['lat'])])
amre_points = MultiPoint(list(map_points.values)) 

plt.clf()
fig = plt.figure()
ax = fig.add_subplot(111, axisbg='w', frame_on=False)
fig.set_size_inches(18.5, 10.5)

# Create a scatterplot on the map
dev = m.scatter(
            [geom.x for geom in map_points],
            [geom.y for geom in map_points],
            20, marker='o', lw=.25,
            facecolor='#33ccff', edgecolor='w',
            alpha=0.9,antialiased=True,
            zorder=3)

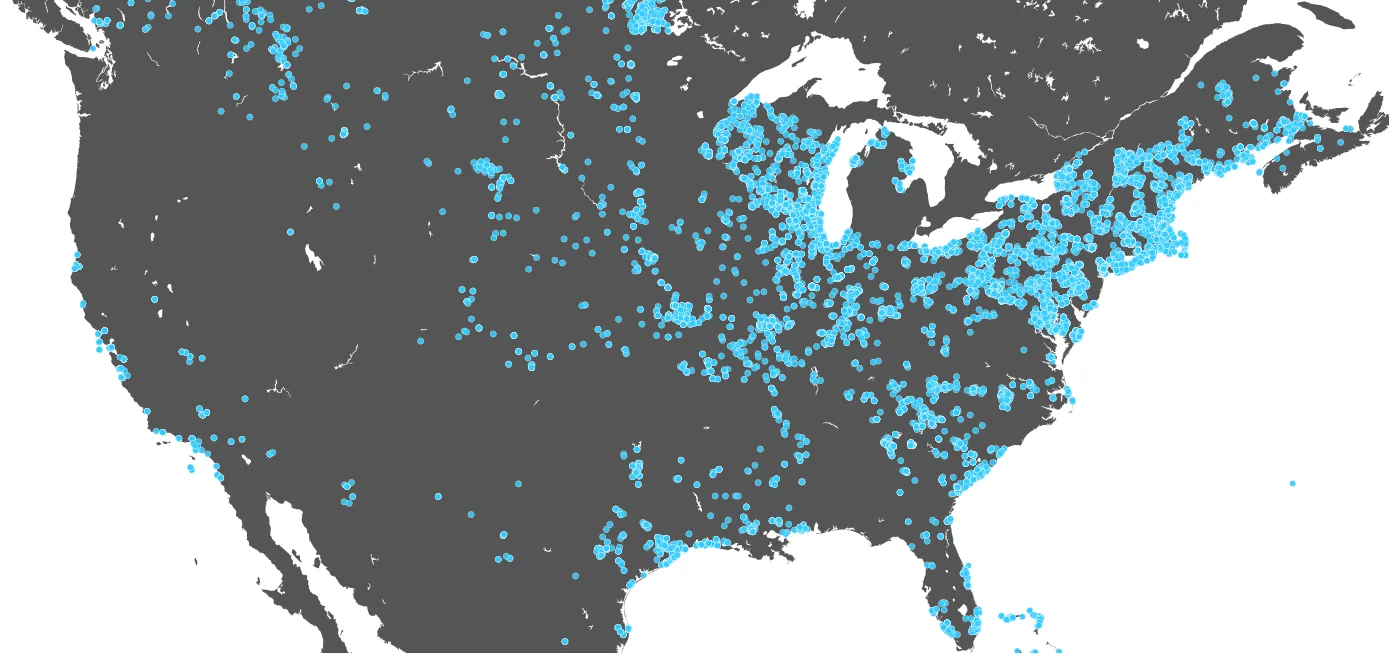
m.fillcontinents(color='#555555')

我得到这张图片:地图


你能展示一下你尝试过的吗? - Aric
1
@Aric 添加了代码,用于在地图上绘制点。 - Nitin
2个回答

19

这里是一种实现的方法:

import networkx as nx
import matplotlib.pyplot as plt
from mpl_toolkits.basemap import Basemap as Basemap
m = Basemap(
        projection='merc',
        llcrnrlon=-130,
        llcrnrlat=25,
        urcrnrlon=-60,
        urcrnrlat=50,
        lat_ts=0,
        resolution='i',
        suppress_ticks=True)

# position in decimal lat/lon
lats=[37.96,42.82]
lons=[-121.29,-73.95]
# convert lat and lon to map projection
mx,my=m(lons,lats)

# The NetworkX part
# put map projection coordinates in pos dictionary
G=nx.Graph()
G.add_edge('a','b')
pos={}
pos['a']=(mx[0],my[0])
pos['b']=(mx[1],my[1])
# draw
nx.draw_networkx(G,pos,node_size=200,node_color='blue')

# Now draw the map
m.drawcountries()
m.drawstates()
m.bluemarble()
plt.title('How to get from point a to point b')
plt.show()

输入图像描述


当您需要将图形适应地图时,这是可以的。但是如果您有一个带有特定坐标的图形,并且想要在图形下方绘制imshow怎么办?通常,imshow会使用行/列数作为索引,但如果您需要这些数字代替坐标呢? - FaCoffee

4
今天起,有一个很好的替代basemap的选择。Mplleaflet是受mpld3启发的库。它比basemap绘制更快,更易于使用,并允许在美丽的交互式开放街图上可视化地理数据。输入可以是经度和纬度,该库会自动正确投影数据。
输入字典pos,其中节点(国家)为键,长纬保存为值。
 pos = {u'Afghanistan': [66.00473365578554, 33.83523072784668],
 u'Aland': [19.944009818523348, 60.23133494165451],
 u'Albania': [20.04983396108883, 41.14244989474517],
 u'Algeria': [2.617323009197829, 28.158938494487625],
 .....

绘图就像这样简单:
import mplleaflet

fig, ax = plt.subplots()

nx.draw_networkx_nodes(GG,pos=pos,node_size=10,node_color='red',edge_color='k',alpha=.5, with_labels=True)
nx.draw_networkx_edges(GG,pos=pos,edge_color='gray', alpha=.1)
nx.draw_networkx_labels(GG,pos, label_pos =10.3)

mplleaflet.display(fig=ax.figure)

不幸的是,mplleaflet无法处理DiGraphs。 - Andi Anderle

网页内容由stack overflow 提供, 点击上面的
可以查看英文原文,
原文链接