在Matplotlib Basemap投影上绘制椭圆形

16

我正在尝试在基本地图投影上绘制椭圆。要绘制类似圆形的多边形,可以使用tissot函数绘制Tissot's indicatrix,如下面的示例所示。

from mpl_toolkits.basemap import Basemap

x0, y0 = 35, -50
R = 5

m = Basemap(width=8000000,height=7000000, resolution='l',projection='aea', 
    lat_1=-40.,lat_2=-60,lon_0=35,lat_0=-50)
m.drawcoastlines()
m.tissot(x0, y0, R, 100, facecolor='g', alpha=0.5)

然而,我想画一个形如 (x-x0)**2/a**2 + (y-y0)**2/2 = 1 的椭圆。另一方面,要在常规笛卡尔坐标系上绘制一个椭圆,我可以使用以下示例代码:

import pylab
from matplotlib.patches import Ellipse

fig = pylab.figure()
ax = pylab.subplot(1, 1, 1, aspect='equal')

x0, y0 = 35, -50
w, h = 10, 5
e = Ellipse(xy=(x0, y0), width=w, height=h, linewidth=2.0, color='g')
ax.add_artist(e)
e.set_clip_box(ax.bbox)
e.set_alpha(0.7)
pylab.xlim([20, 50])
pylab.ylim([-65, -35])

有没有一种方式可以在 Basemap 投影上绘制一个椭圆,并产生类似于 tissot 的效果?

1个回答

24

经过数小时分析basemap的tissot函数源代码,学习了椭圆的一些属性以及进行了大量调试后,我找到了解决问题的方法。我扩展了basemap类并添加了一个名为ellipse的新函数,如下所示:

from __future__ import division
import pylab
import numpy

from matplotlib.patches import Polygon
from mpl_toolkits.basemap import pyproj
from mpl_toolkits.basemap import Basemap

class Basemap(Basemap):
    def ellipse(self, x0, y0, a, b, n, ax=None, **kwargs):
        """
        Draws a polygon centered at ``x0, y0``. The polygon approximates an
        ellipse on the surface of the Earth with semi-major-axis ``a`` and 
        semi-minor axis ``b`` degrees longitude and latitude, made up of 
        ``n`` vertices.

        For a description of the properties of ellipsis, please refer to [1].

        The polygon is based upon code written do plot Tissot's indicatrix
        found on the matplotlib mailing list at [2].

        Extra keyword ``ax`` can be used to override the default axis instance.

        Other \**kwargs passed on to matplotlib.patches.Polygon

        RETURNS
            poly : a maptplotlib.patches.Polygon object.

        REFERENCES
            [1] : http://en.wikipedia.org/wiki/Ellipse


        """
        ax = kwargs.pop('ax', None) or self._check_ax()
        g = pyproj.Geod(a=self.rmajor, b=self.rminor)
        # Gets forward and back azimuths, plus distances between initial
        # points (x0, y0)
        azf, azb, dist = g.inv([x0, x0], [y0, y0], [x0+a, x0], [y0, y0+b])
        tsid = dist[0] * dist[1] # a * b

        # Initializes list of segments, calculates \del azimuth, and goes on 
        # for every vertex
        seg = [self(x0+a, y0)]
        AZ = numpy.linspace(azf[0], 360. + azf[0], n)
        for i, az in enumerate(AZ):
            # Skips segments along equator (Geod can't handle equatorial arcs).
            if numpy.allclose(0., y0) and (numpy.allclose(90., az) or
                numpy.allclose(270., az)):
                continue

            # In polar coordinates, with the origin at the center of the 
            # ellipse and with the angular coordinate ``az`` measured from the
            # major axis, the ellipse's equation  is [1]:
            #
            #                           a * b
            # r(az) = ------------------------------------------
            #         ((b * cos(az))**2 + (a * sin(az))**2)**0.5
            #
            # Azymuth angle in radial coordinates and corrected for reference
            # angle.
            azr = 2. * numpy.pi / 360. * (az + 90.)
            A = dist[0] * numpy.sin(azr)
            B = dist[1] * numpy.cos(azr)
            r = tsid / (B**2. + A**2.)**0.5
            lon, lat, azb = g.fwd(x0, y0, az, r)
            x, y = self(lon, lat)

            # Add segment if it is in the map projection region.
            if x < 1e20 and y < 1e20:
                seg.append((x, y))

        poly = Polygon(seg, **kwargs)
        ax.add_patch(poly)

        # Set axes limits to fit map region.
        self.set_axes_limits(ax=ax)

        return poly

这个新函数可以像这个例子一样迅速使用:

pylab.close('all')
pylab.ion()

m = Basemap(width=12000000, height=8000000, resolution='l', projection='stere',
            lat_ts=50, lat_0=50, lon_0=-107.)
m.drawcoastlines()
m.fillcontinents(color='coral',lake_color='aqua')
# draw parallels and meridians.
m.drawparallels(numpy.arange(-80.,81.,20.))
m.drawmeridians(numpy.arange(-180.,181.,20.))
m.drawmapboundary(fill_color='aqua') 
# draw ellipses
ax = pylab.gca()
for y in numpy.linspace(m.ymax/20, 19*m.ymax/20, 9):
    for x in numpy.linspace(m.xmax/20, 19*m.xmax/20, 12):
        lon, lat = m(x, y, inverse=True)
        poly = m.ellipse(lon, lat, 3, 1.5, 100, facecolor='green', zorder=10,
            alpha=0.5)
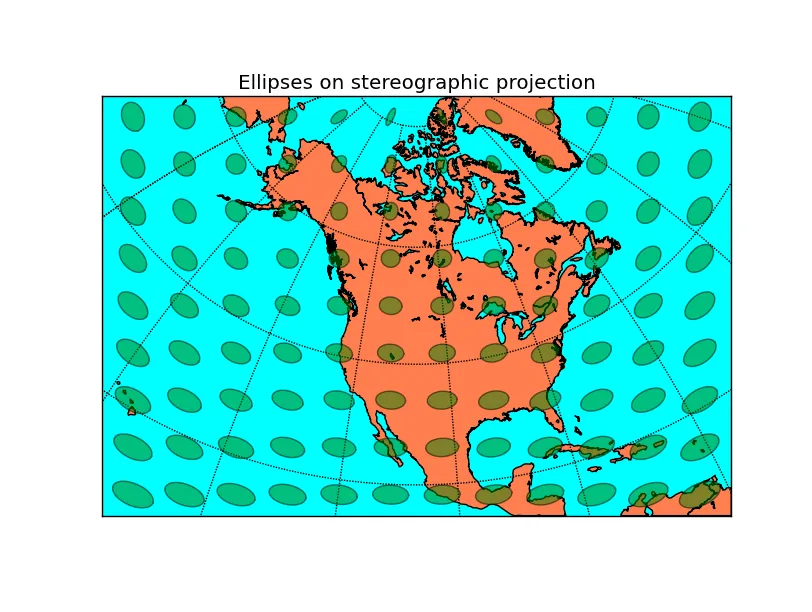
pylab.title("Ellipses on stereographic projection")

以下是结果:

这将产生以下结果:示例图片


6
我知道回答我的问题似乎有些作弊,但我花了一些时间和启发才想出这个解决方案。尽管如此,我觉得我可以分享一下。请问需要翻译的是:I know it might seem like cheating to answer my own question, but it took me a while and some enlightening to come to this solution. I thought I could share it even though. - regeirk
7
这不是作弊,这是正确的做法:http://meta.stackexchange.com/questions/12513/should-i-not-answer-my-own-questions - Yann

网页内容由stack overflow 提供, 点击上面的
可以查看英文原文,
原文链接