使用matplotlib Basemap绘制GDAL光栅图

17

我想使用matplotlib Basemap绘制一个栅格TIFF图像(下载-723Kb)。我的栅格投影坐标单位是米:

In  [2]:
path = r'albers_5km.tif'
raster = gdal.Open(path, gdal.GA_ReadOnly)
array = raster.GetRasterBand(20).ReadAsArray()

print ('Raster Projection:\n', raster.GetProjection())
print ('Raster GeoTransform:\n', raster.GetGeoTransform())

Out [2]:
Raster Projection:
 PROJCS["unnamed",GEOGCS["WGS 84",DATUM["WGS_1984",SPHEROID["WGS 84",6378137,298.257223563,AUTHORITY["EPSG","7030"]],AUTHORITY["EPSG","6326"]],PRIMEM["Greenwich",0],UNIT["degree",0.0174532925199433],AUTHORITY["EPSG","4326"]],PROJECTION["Albers_Conic_Equal_Area"],PARAMETER["standard_parallel_1",15],PARAMETER["standard_parallel_2",65],PARAMETER["latitude_of_center",30],PARAMETER["longitude_of_center",95],PARAMETER["false_easting",0],PARAMETER["false_northing",0],UNIT["metre",1,AUTHORITY["EPSG","9001"]]]
Raster GeoTransform:
 (190425.8243, 5000.0, 0.0, 1500257.0112, 0.0, -5000.0)
如果我尝试使用 Robin 投影和 contourflatlon=False)绘制此图,那么假定 x 和 y 是地图投影坐标(请参阅文档,我认为那就是我所拥有的)。但是,如果我看一下这个图,我会注意到它被放置在左下角非常小的位置:
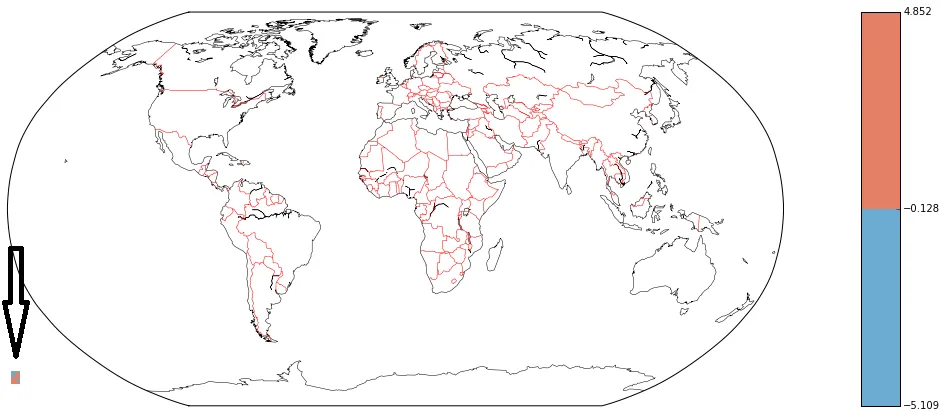
bottom-left。使用以下代码:
In  [3]:
xy = raster.GetGeoTransform() 
x = raster.RasterXSize 
y = raster.RasterYSize    
lon_start = xy[0] 
lon_stop = x*xy[1]+xy[0] 
lon_step = xy[1]    
lat_start = xy[3] 
lat_stop = y*xy[5]+xy[3] 
lat_step = xy[5]

fig = plt.figure(figsize=(16,10)) 
map = Basemap(projection='robin',resolution='c',lat_0=0,lon_0=0)

lons = np.arange(lon_start, lon_stop, lon_step) 
lats = np.arange(lat_start, lat_stop, lat_step)    
xx, yy = np.meshgrid(lons,lats)

levels = [array.min(),-0.128305,array.max()] 
map.contourf(xx, yy,array, levels, cmap=cm.RdBu_r, latlon=False)

map.colorbar(cntr,location='right',pad='10%')    
map.drawcoastlines(linewidth=.5) 
map.drawcountries(color='red')

最终我不想拥有一个全局视角,而是希望有一个详细的视角。这给了我一个放大级别,可以在其中绘制海岸线和国家,但数据再次放置在左下角,但不像以前那么小:
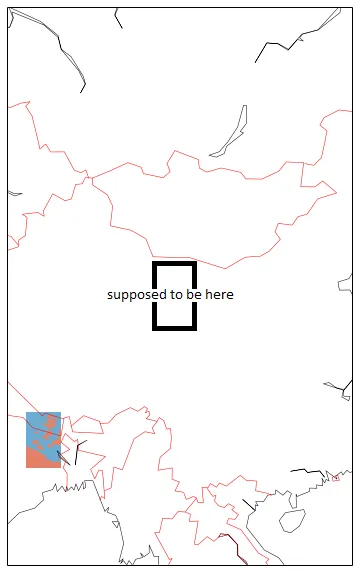
再次位于左下角

使用以下代码:

In  [4]:
extent = [ xy[0],xy[0]+x*xy[1], xy[3],xy[3]+y*xy[5]]
width_x = (extent[1]-extent[0])*10
height_y = (extent[2]-extent[3])*10

fig = plt.figure(figsize=(16,10))
map = Basemap(projection='stere', resolution='c', width = width_x , height = height_y, lat_0=40.2,lon_0=99.6,)

xx, yy = np.meshgrid(lons,lats)
levels = [array.min(),-0.128305,array.max()]
map.contourf(xx, yy, array, levels, cmap=cm.RdBu_r, latlon=False)

map.drawcoastlines(linewidth=.5)
map.drawcountries(color='red')

应该是 projection='stereo' 吧?(那里缺少一个“o”,可能只是打错了) - usethedeathstar
不,它说“立体声”是不支持的投影。 “stere”用于立体投影。 - Mattijn
有趣的是,如果我要为立体投影制作一个简称,它会是“stereo”,而不是“stere”;-) 但也许所有投影的缩写都是5个字符左右。 - usethedeathstar
你正在绘制 Albers (AEA) 坐标,就好像它们是 Robinson 或 Stereographic 一样。在绘制之前,你需要将 xxyy 投影到你的地图投影上。 - Rutger Kassies
@Mattijn,我不确定Basemap是否能够做到,但我认为应该可以。我看到你已经有了GDAL,因此使用GDAL的ct.TransformPoints()肯定可以解决问题。我不介意为您制作一个示例,但不是立即,我还有其他工作要做。如果您经常制作这样的图表,请查看Cartopy,它肯定有一个即时选项:http://scitools.org.uk/cartopy/docs/latest/gallery.html - Rutger Kassies
显示剩余2条评论
1个回答

25
您可以使用以下代码来转换坐标,它会自动将栅格的投影作为源投影,将Basemap对象的投影作为目标坐标系。

导入

from mpl_toolkits.basemap import Basemap
import osr, gdal
import matplotlib.pyplot as plt
import numpy as np

坐标转换

def convertXY(xy_source, inproj, outproj):
    # function to convert coordinates
    
    shape = xy_source[0,:,:].shape
    size = xy_source[0,:,:].size

    # the ct object takes and returns pairs of x,y, not 2d grids
    # so the the grid needs to be reshaped (flattened) and back.
    ct = osr.CoordinateTransformation(inproj, outproj)
    xy_target = np.array(ct.TransformPoints(xy_source.reshape(2, size).T))

    xx = xy_target[:,0].reshape(shape)
    yy = xy_target[:,1].reshape(shape)
    
    return xx, yy

读取和处理数据

# Read the data and metadata
ds = gdal.Open(r'albers_5km.tif')

data = ds.ReadAsArray()
gt = ds.GetGeoTransform()
proj = ds.GetProjection()

xres = gt[1]
yres = gt[5]

# get the edge coordinates and add half the resolution 
# to go to center coordinates
xmin = gt[0] + xres * 0.5
xmax = gt[0] + (xres * ds.RasterXSize) - xres * 0.5
ymin = gt[3] + (yres * ds.RasterYSize) + yres * 0.5
ymax = gt[3] - yres * 0.5

ds = None

# create a grid of xy coordinates in the original projection
xy_source = np.mgrid[ymax+yres:ymin:yres, xmin:xmax+xres:xres]

绘图

# Create the figure and basemap object
fig = plt.figure(figsize=(12, 6))
m = Basemap(projection='robin', lon_0=0, resolution='c')

# Create the projection objects for the convertion
# original (Albers)
inproj = osr.SpatialReference()
inproj.ImportFromWkt(proj)

# Get the target projection from the basemap object
outproj = osr.SpatialReference()
outproj.ImportFromProj4(m.proj4string)

# Convert from source projection to basemap projection
xx, yy = convertXY(xy_source, inproj, outproj)

# plot the data (first layer)
im1 = m.pcolormesh(xx, yy, data[0,:,:], cmap=plt.cm.jet, shading='auto')

# annotate
m.drawcountries()
m.drawcoastlines(linewidth=.5)

plt.savefig('world.png',dpi=75)

enter image description here

如果您需要像素位置完全正确,您可能需要仔细检查坐标数组的创建(因为我根本没有)。这个例子应该会让您走上正确的轨道。


这确实让我走上了正确的轨道。感谢您提供这个好答案。在Python环境中能够同时进行分析和绘图真的很不错。 - Mattijn
如果栅格图像中只有一个波段,那么以上代码需要更改什么? - mArk
@SaiKiran,这可能取决于您有多少维度。但是如果您的数据是2D的,您可能需要将data [0,:,:]更改为data - Rutger Kassies
@RutgerKassies 你好。我一直在尝试复制你的代码,但是不幸的是完全没有成功。我能够使用basemap绘制整个全局轮廓,但我的gdal图形没有显示出来。我还收到了这个警告消息:MatplotlibDeprecationWarning: shading='flat' when X and Y have the same dimensions as C is deprecated since 3.3. Either specify the corners of the quadrilaterals with X and Y, or pass shading='auto', 'nearest' or 'gouraud', or set rcParams['pcolor.shading']. 已经尝试设置其他阴影选项,但错误仍然存在。 - Gabriel Lucas
1
@GabrielLucas,我对帖子进行了一些编辑。使用np.mgrid翻转了坐标生成,删除了数据的转置,并添加了shading="auto"。这样就消除了我的警告。如果Basemap无法使用,请查看Cartopy。 - Rutger Kassies
显示剩余3条评论

网页内容由stack overflow 提供, 点击上面的
可以查看英文原文,
原文链接