我想绘制多个子图在地图上,每个子图都会以一个地理位置或一个绘图坐标为中心。节点本身没有位置(或它们都属于一个城市),但每个子图对应一个局部情况。
- I tried to assign a position to only one node per subgraph, leaving the remaining of the graph to be plotted by defaults using "centered" option
I tried to inspire from https://dev59.com/ul0b5IYBdhLWcg3wIOB9#29597209 to plot a hierarchically graph on a position but withou success
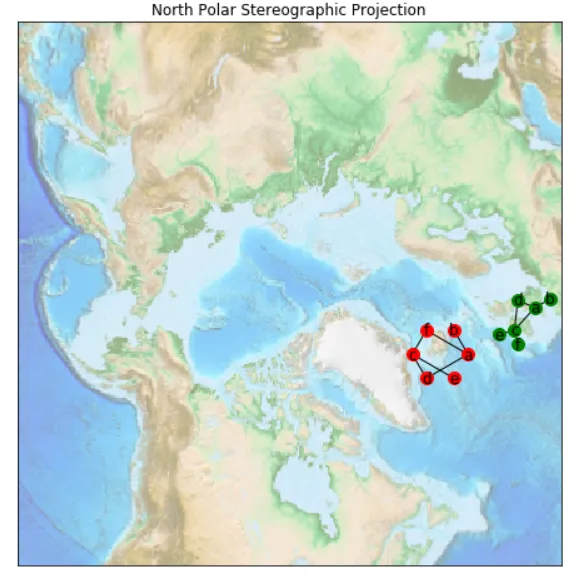
# -*- coding: utf-8 -*-
import networkx as nx
import pygraphviz
import matplotlib.pyplot as plt
from mpl_toolkits.basemap import Basemap as Basemap

G1 = nx.Graph()
G1.add_edge('a', 'b', weight=0.6)
G1.add_edge('a', 'c', weight=0.2)
G1.add_edge('c', 'd', weight=0.1)
G1.add_edge('c', 'e', weight=0.7)
G1.add_edge('c', 'f', weight=0.9)
G1.add_edge('a', 'd', weight=0.3)

G2 = nx.Graph()
G2.add_edge('a', 'b', weight=0.9)
G2.add_edge('a', 'f', weight=0.5)
G2.add_edge('c', 'd', weight=0.1)
G2.add_edge('c', 'e', weight=0.4)
G2.add_edge('c', 'f', weight=0.2)
G2.add_edge('a', 'd', weight=0.1)

edges = G.edges()
weights = [G[u][v]['weight'] for u,v in edges] # liste des poids des edges

fig = plt.figure(figsize=(8, 8))
m = Basemap(projection='npstere',boundinglat=48,lon_0=270,resolution='l')
m.etopo(scale=0.5, alpha=0.5)
mx1,my1=m(-6.266155,53.350140) #would be long, lat coordinates of city 1
mx2,my2=m(-21.827774, 64.128288) #would be long, lat coordinates of city 2

nx.draw_networkx(G1,center=(mx1,my1),pos=nx.spring_layout(G1),node_size=200,node_color='green')
nx.draw_networkx(G2,center=(mx2,my2),pos=nx.spring_layout(G2),node_size=200,node_color='red')
plt.title("North Polar Stereographic Projection")
plt.show()