我的networkx图包含具有名为“coords”(x,y)的属性的对象:
import networkx as nx
import matplotlib.pyplot as plt
class device():
def __init__(self, name):
self.name = name
self.coords = (0,0)
def __repr__(self):
return self.name
device1 = device('1')
device1.coords = (20, 5)
device2 = device('2')
device2.coords = (-4, 10.5)
device3 = device('3')
device3.coords = (17, -5)
G = nx.Graph()
G.add_nodes_from([device1, device2, device3])
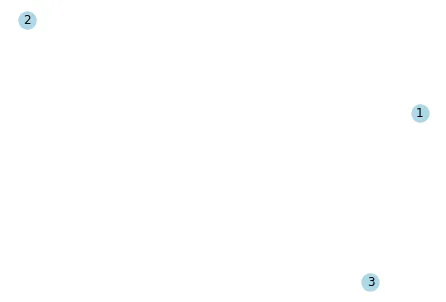
nx.draw(G, with_labels = True)
plt.show()
每当我用matplotlib绘图时,它都会以混乱的顺序绘制图形。如何按照坐标绘制这样的图形呢?