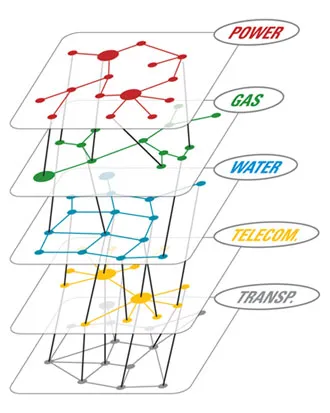
我正在尝试可视化几个代表不同对象的图表。我想创建一个看起来像这里的图像:
以下答案可能不是完整的解决方案,但是它是使用networkx渲染3D图形的工作演示。networkx本身无法渲染3D图形。我们需要安装mayavi才能实现。
import networkx as nx
import matplotlib.pyplot as plt
import numpy as np
from mayavi import mlab

import random

def draw_graph3d(graph, graph_colormap='winter', bgcolor = (1, 1, 1),
                 node_size=0.03,
                 edge_color=(0.8, 0.8, 0.8), edge_size=0.002,
                 text_size=0.008, text_color=(0, 0, 0)):

    H=nx.Graph()

    # add edges
    for node, edges in graph.items():
        for edge, val in edges.items():
            if val == 1:
                H.add_edge(node, edge)

    G=nx.convert_node_labels_to_integers(H)

    graph_pos=nx.spring_layout(G, dim=3)

    # numpy array of x,y,z positions in sorted node order
    xyz=np.array([graph_pos[v] for v in sorted(G)])

    # scalar colors
    scalars=np.array(G.nodes())+5
    mlab.figure(1, bgcolor=bgcolor)
    mlab.clf()

    #----------------------------------------------------------------------------
    # the x,y, and z co-ordinates are here
    # manipulate them to obtain the desired projection perspective
    pts = mlab.points3d(xyz[:,0], xyz[:,1], xyz[:,2],
                        scalars,
                        scale_factor=node_size,
                        scale_mode='none',
                        colormap=graph_colormap,
                        resolution=20)
    #----------------------------------------------------------------------------

    for i, (x, y, z) in enumerate(xyz):
        label = mlab.text(x, y, str(i), z=z,
                          width=text_size, name=str(i), color=text_color)
        label.property.shadow = True

    pts.mlab_source.dataset.lines = np.array(G.edges())
    tube = mlab.pipeline.tube(pts, tube_radius=edge_size)
    mlab.pipeline.surface(tube, color=edge_color)

    mlab.show() # interactive window

# create tangled hypercube
def make_graph(nodes):

    def make_link(graph, i1, i2):
        graph[i1][i2] = 1
        graph[i2][i1] = 1

    n = len(nodes)

    if n == 1: return {nodes[0]:{}}

    nodes1 = nodes[0:n/2]
    nodes2 = nodes[n/2:]
    G1 = make_graph(nodes1)
    G2 = make_graph(nodes2)

    # merge G1 and G2 into a single graph
    G = dict(G1.items() + G2.items())

    # link G1 and G2
    random.shuffle(nodes1)
    random.shuffle(nodes2)
    for i in range(len(nodes1)):
        make_link(G, nodes1[i], nodes2[i])

    return G

# graph example
nodes = range(10)
graph = make_graph(nodes)
draw_graph3d(graph)
这段代码是从一个示例这里修改而来的。 当你成功达到目标时,请发布此代码。