我刚刚使用cowplot包建立了一个网格(用于标记A-D图)。这些图是用ggplot2包制作的:
pfour<-ggplot(four, aes(x=Concentration, y=Percentage, fill=Phenotype)) +
 geom_bar(stat='identity',color='black') +
 scale_fill_grey(start = .4, end = .9) +
 theme_bw()+ylab("Distribution") +
 xlab("Contentration [mg/ml]") +
 ggtitle("96 hpf") +
 theme(legend.title = element_text(colour="black", size=10, face="bold")) +
 theme(legend.background = element_rect(fill="white",
                                        size=0.5, linetype="solid",
                                        colour ="black")) +
 scale_x_discrete(limits=c('uninjected','control','0.002', '0.02', '0.2'),
                  labels=c('uninjected\n(n=251)',
                           'control\n(n=248)',
                           '0.002\n(n=205)',
                           '0.02\n(n=222)',
                           '0.2\n(n=203)'))
数据看起来是这样的(4个不同的表格,百分比略有不同,但原理相同):
Concentration,Percentage,Phenotype
uninjected,0.996015936,0
uninjected,0,1
uninjected,0.003984064,2
uninjected,0,3
uninjected,0,4
control,0.995967742,0
control,0.004032258,1
control,0,2
control,0,3
control,0,4
0.002,0.985365854,0
0.002,0.004878049,1
0.002,0.004878049,2
0.002,0,3
0.002,0.004878049,4
0.02,0.981981982,0
0.02,0.004504505,1
0.02,0.004504505,2
0.02,0.004504505,3
0.02,0.004504505,4
0.2,0.985221675,0
0.2,0.004926108,1
0.2,0,2
而它看起来是这样的:
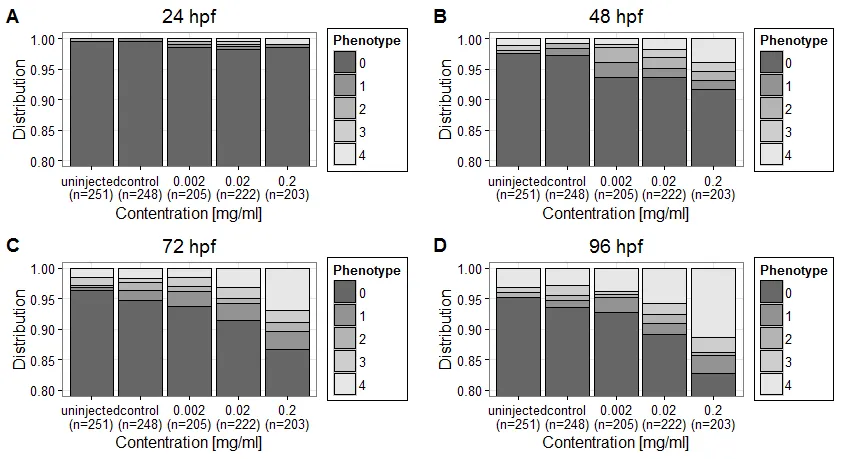
那个的代码是:
plot_grid(ponezoom, ptwozoom,pthreezoom,pfourzoom, align='h', labels=c('A', 'B','C','D'))
我在想是否可能获得一个单一的共享图例来覆盖所有四个图,因为如果它出现4次,它会占用大量的绘图空间。感谢任何帮助。