根据我对grobs的理解,我认为在使用
plot_grid组合图之前,先获取每个图的坐标并添加边界线段会更容易一些。
示例数据:
library(gtable)
library(cowplot)
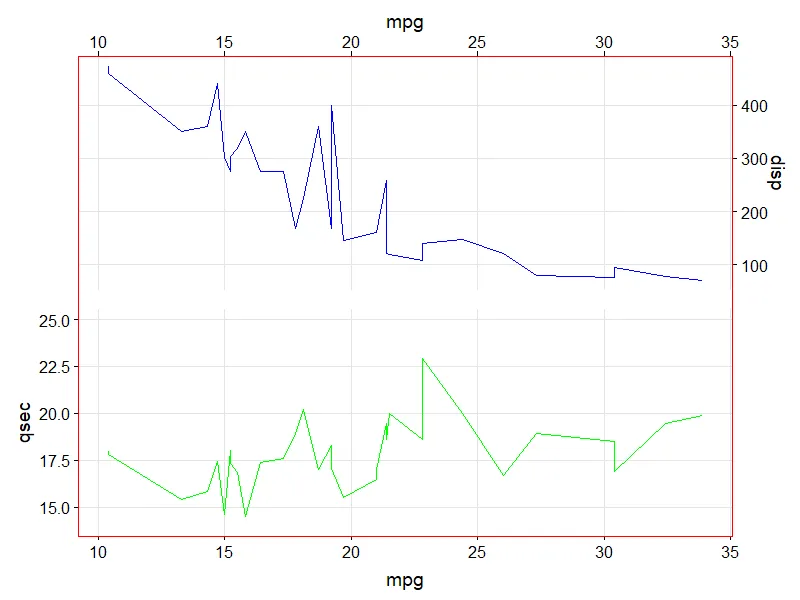
p1 <- ggplot(mtcars, aes(mpg, disp)) +
geom_line(colour = 'blue') +
scale_x_continuous(position = "top") +
scale_y_continuous(position = "right") +
background_grid(minor = 'none'); p1
p2 <- ggplot(mtcars, aes(mpg, qsec)) +
geom_line(colour = 'green') +
ylim(14, 25) +
background_grid(minor = 'none'); p2
g1 <- ggplotGrob(p1)
g2 <- ggplotGrob(p2)
函数用于为每个绘图grob添加适当的边框段,其中:
grob是通过ggplotGrob创建的grob对象;sides是包含任意排列组合的字符字符串"t"/ "l"/ "b"/ "r",表示所需边框位置的方向;col是所需的边框颜色(默认为红色);... 用于将其他参数传递给segmentsGrob()中的gpar()
.
最初的回答:
这个函数是用来给每个绘图元素加边框的。其中,你需要输入grob对象(由ggplotGrob生成),sides是一个字符串,里面包含了"t", "l", "b",和"r"这四种字母的任意组合,代表需要加边框的方向。你可以选择边框的颜色,如果不指定,默认为红色。另外还可以使用"..."传入其他参数到segmentsGrob()中的gpar()函数。
library(grid)
add.segments <- function(grob, sides = "tlbr", col = "red", ...){
panel.coords <- g1[["layout"]][g1[["layout"]][["name"]] == "panel", ]
t <- if(grepl("t", sides)) panel.coords[["t"]] else 1
b <- if(grepl("b", sides)) panel.coords[["b"]] else length(grob[["heights"]])
l <- if(grepl("l", sides)) panel.coords[["l"]] else 1
r <- if(grepl("r", sides)) panel.coords[["r"]] else length(grob[["widths"]])
coords <- data.frame(direction = c("t", "b", "l", "r"),
x0 = c(0, 0, 0, 1), y0 = c(1, 0, 0, 0),
x1 = c(1, 1, 0, 1), y1 = c(1, 0, 1, 1),
stringsAsFactors = FALSE)
coords <- coords[sapply(coords$direction, grepl, sides), ]
grob <- gtable_add_grob(x = grob,
grobs = segmentsGrob(
x0 = coords[["x0"]], y0 = coords[["y0"]],
x1 = coords[["x1"]], y1 = coords[["y1"]],
gp = gpar(col = col, ...)
),
t = t, l = l, b = b, r = r,
clip = "off", name = "segments")
return(grob)
}
使用方法:
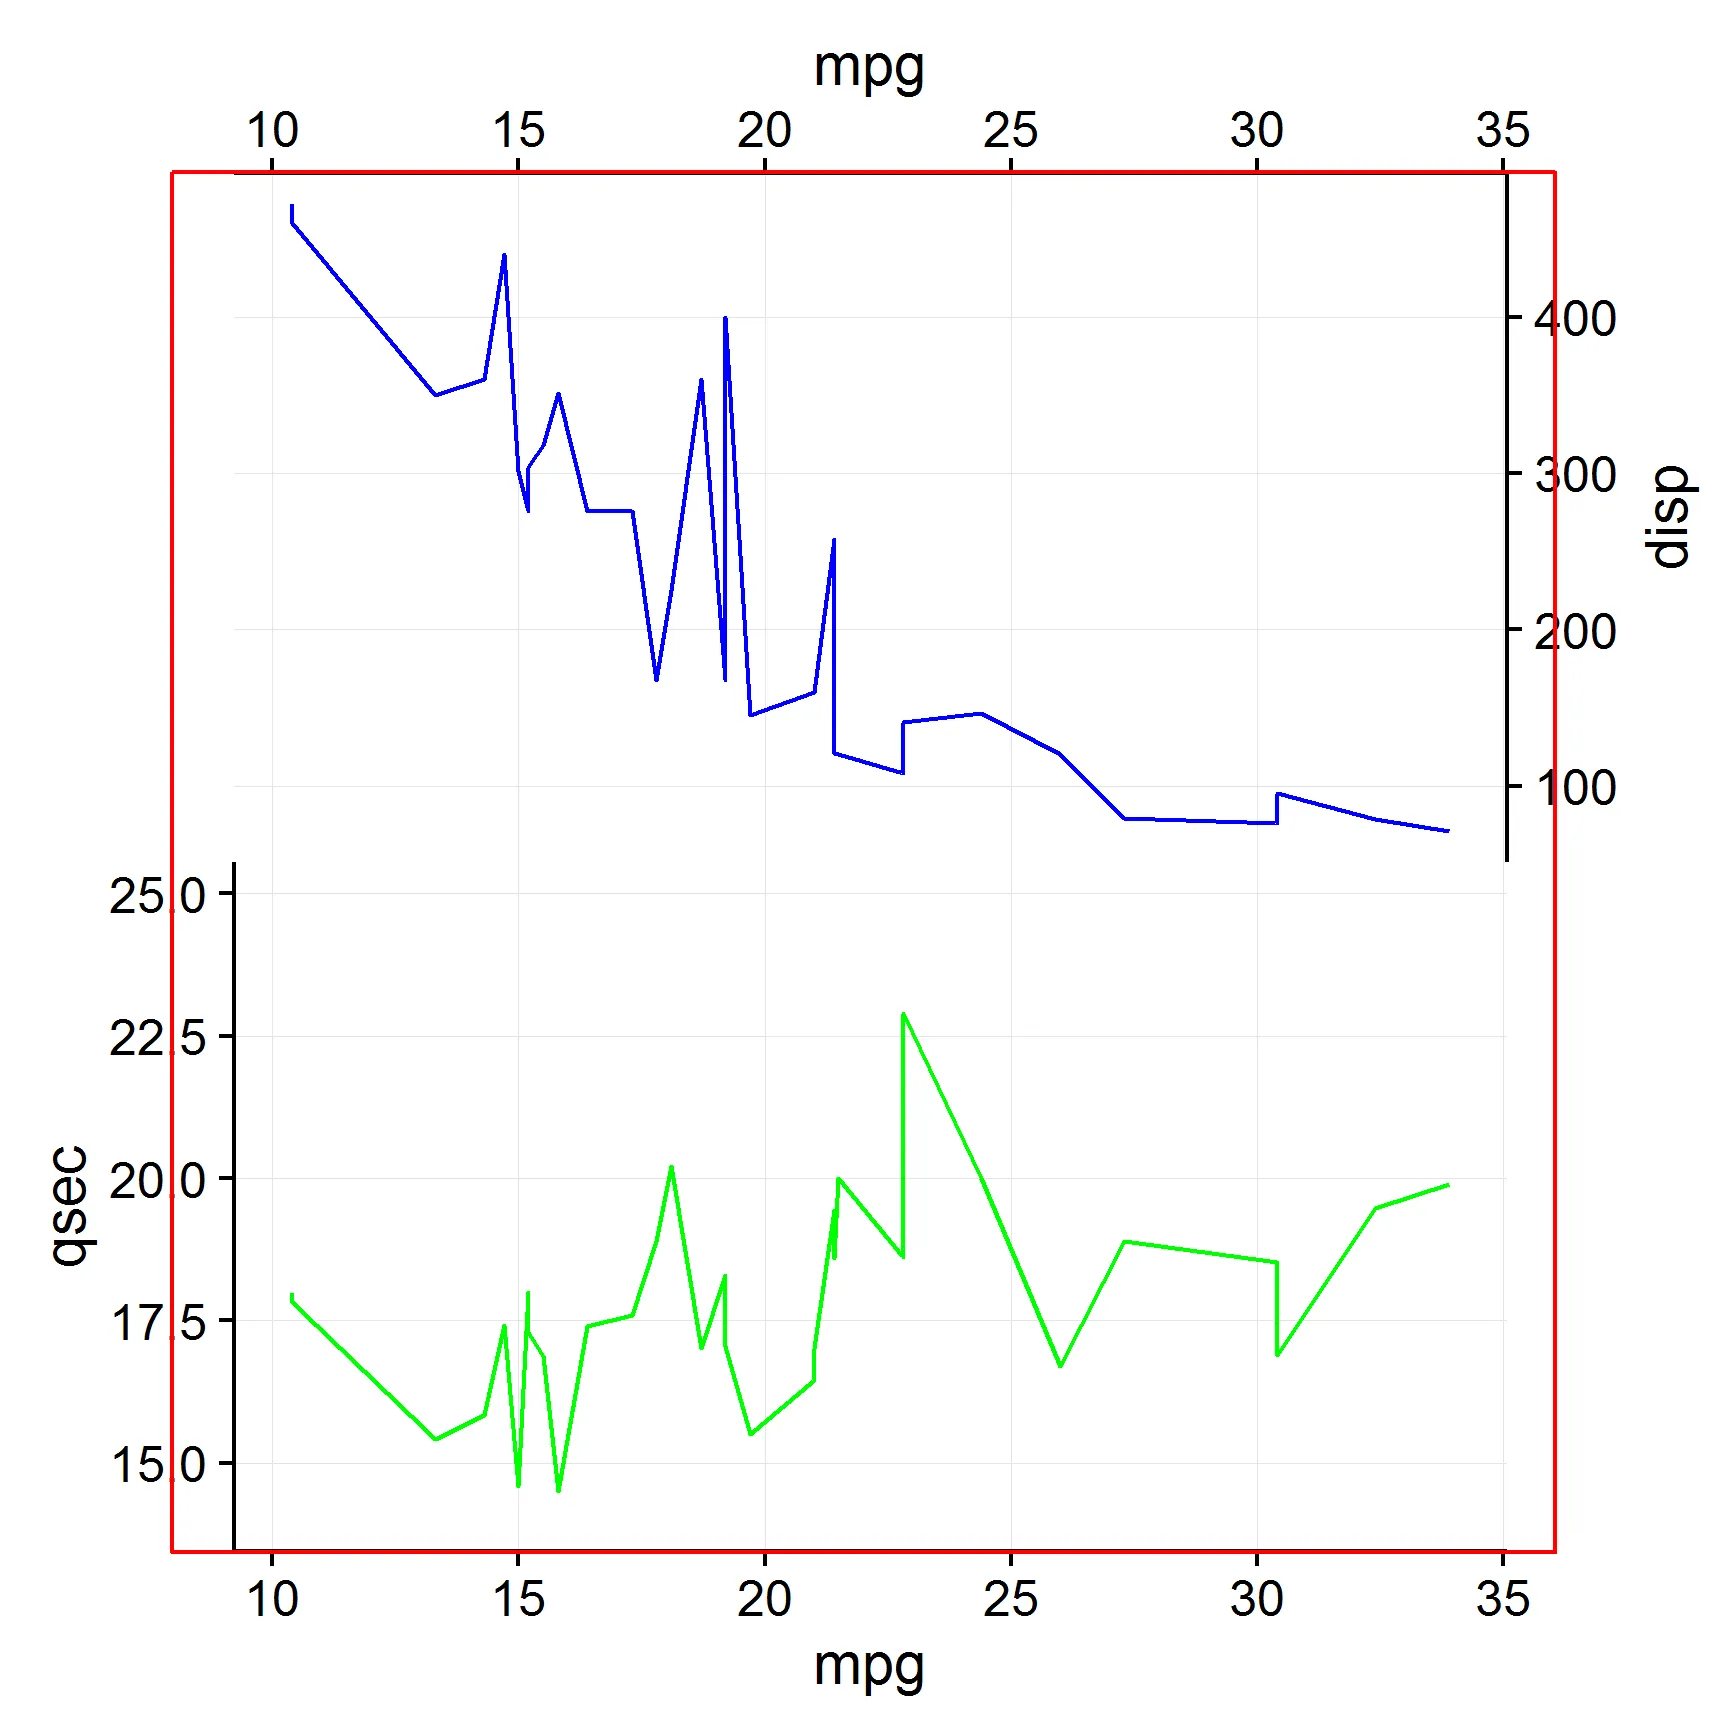
plot_grid(add.segments(g1, "tlr"),
          add.segments(g2, "lbr"),
          ncol = 1, align = "v")
最初的回答:
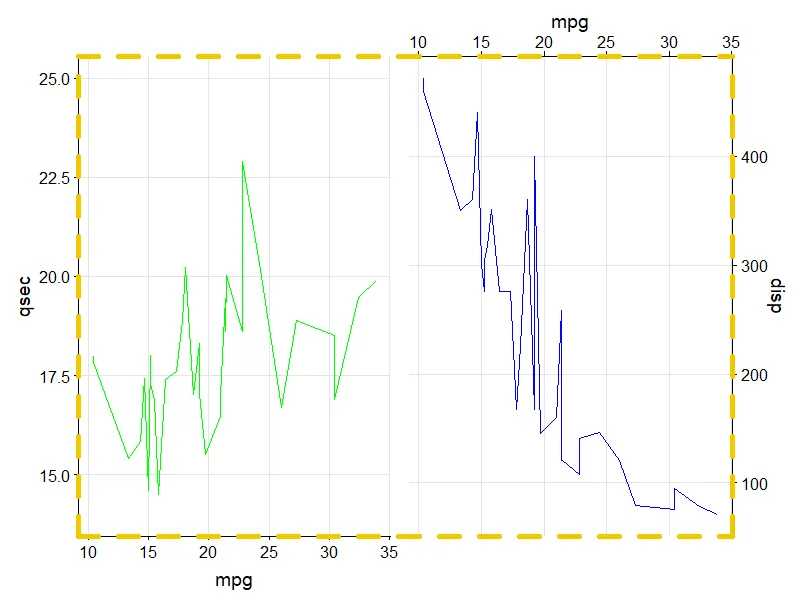
另一个例子,将两个图水平对齐(好吧,将这些特定的图并排放置没有意义,但您明白了):
plot_grid(add.segments(g2, "tlb", col = "gold2", lty = 2, lwd = 5),
          add.segments(g1, "trb", col = "gold2", lty = 2, lwd = 5),
          nrow = 1, align = "h")