我正在使用ggplot2和cowplot包制作一个多面板图,但我需要改变单个图的高度。这最好通过一个例子来说明。
library(ggplot2)
library(cowplot)

p1 <- ggplot(iris, aes(Sepal.Width, Sepal.Length, colour = Species)) +
             geom_point() +
             theme(axis.text.x = element_blank(),
                   axis.title.x = element_blank(),
                   legend.position = "none")
p2 <- ggplot(iris, aes(Sepal.Width, Sepal.Length, colour = Species)) +
             geom_point() +
             theme(axis.text.x = element_blank(),
                   axis.title.x = element_blank(),
                   axis.text.y = element_blank(),
                   axis.title.y = element_blank(),
                   legend.position = "none")
p3 <- ggplot(iris, aes(Sepal.Width, Sepal.Length, colour = Species)) +
             geom_point() +
             theme(axis.text.y = element_blank(),
                   axis.title.y = element_blank(),
                   legend.position = "none")
p4 <- ggplot(iris, aes(Sepal.Width, Sepal.Length, colour = Species)) +
             geom_point() +
             theme(legend.position = "none")
p5 <- ggplot(iris, aes(Sepal.Width, Sepal.Length, colour = Species)) +
             geom_point() +
             theme(axis.text.y = element_blank(),
                   axis.title.y = element_blank(),
                   legend.position = "none")

pL <- ggplot(iris, aes(Sepal.Width, Sepal.Length, colour = Species)) + geom_point()
l <- get_legend(pL)

# simple grid
plot_grid(p1, p2, p3, p4, p5, l, ncol = 3)
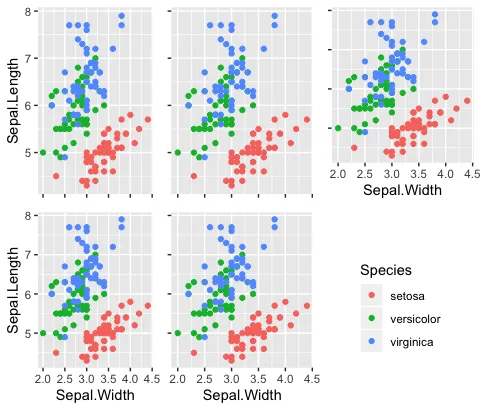
在右上方的面板中,由于包含了x轴标题,因此与同一行中的其他两个面板相比,y轴已经缩小了。
那么我该如何设置单个面板的相对高度和宽度,以便y轴与顶部行中的面板的y轴对齐?
您无法使用rel_heights =和rel_widths() =参数来设置单个面板,并且当我尝试添加axis = "tblr"和align = "hv"参数时,会出现错误消息。
Error in `[.unit.list`(sizes[[x]], list_indices[[x]]) :
  index out of bounds (unit list subsetting)

cowplot?我觉得用facet_wrap构建图表可能更容易,然后只需使用theme(legend.position)将图例从默认位置移动即可。然而,如果必须使用cowplot,你可以看一下ggdraw和draw_plot函数。 - undefined