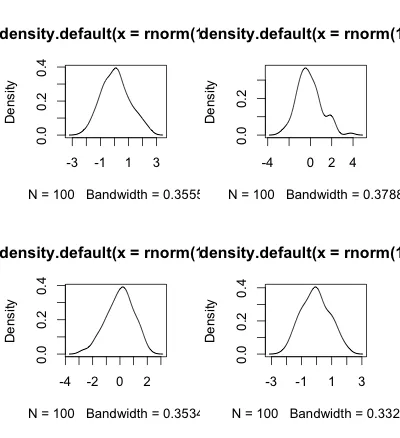
在基础绘图中,我可以通过以下方式创建一个由四个面板组成的图形面板:
par(mfrow=c(2,2))
for (i in 1:4){
  plot(density(rnorm(100)))
}
这将导致
我想用ggplot2做同样的事情,但我不知道该怎么做。我不能使用 facets,因为我的真实数据与这个简单的例子不同,结构也非常不同,并且我希望有两个图形是散点图,另外两个是直方图。如何在 ggplot2 中创建面板或窗格?
在基础绘图中,我可以通过以下方式创建一个由四个面板组成的图形面板:
par(mfrow=c(2,2))
for (i in 1:4){
plot(density(rnorm(100)))
}
这将导致
我想用ggplot2做同样的事情,但我不知道该怎么做。我不能使用 facets,因为我的真实数据与这个简单的例子不同,结构也非常不同,并且我希望有两个图形是散点图,另外两个是直方图。如何在 ggplot2 中创建面板或窗格?
参考Josh O'Brien的例子:我很惊讶没有人提到gridExtra包中的grid.arrange:
library(gridExtra)
grid.arrange(q1,q2,q3,q4,q5,q6,nrow=3)
这个问题好像已经在这里提到了:multiple graphs in one canvas using ggplot2
对我来说,这比记住所有的视口设置要容易得多。
grid.layout()的选项设置。 - Josh O'Briengrid.arrange相比于multiplot有以下几个增强:i) 可处理网格/栅格对象;ii) 与ggsave兼容;iii) 布局参数;iv) 默认的nrow/ncol;v) arrangeGrob版本,可以避免直接绘图;vi) 左右两侧标题的占位符;vii) as.table参数可反转绘制顺序。 - baptisteggsave(file =“whatever.pdf”,arrangeGrob(p1,p2,p3))和最新版本的gridExtra。 grid.arrange仅显示,arrangeGrob是您需要存储对象的内容。 ggsave在内部跟踪最新的ggplot2打印,但grid.arrange没有。 - baptiste编辑:{Ben Bolker指出了一个更好的选择,即来自gridExtra包的grid.arrange。但是,如果你是ggplot2用户,则R Cookbook网站仍然值得一看。}
在R Cookbook的这个页面上有一个很好的multiplot函数的代码(绝对值得一访),它对于这种情况非常有用。直接引用该网站的内容:
multiplot <- function(..., plotlist=NULL, cols) {
    require(grid)

    # Make a list from the ... arguments and plotlist
    plots <- c(list(...), plotlist)

    numPlots = length(plots)

    # Make the panel
    plotCols = cols                       # Number of columns of plots
    plotRows = ceiling(numPlots/plotCols) # Number of rows needed, calculated from # of cols

    # Set up the page
    grid.newpage()
    pushViewport(viewport(layout = grid.layout(plotRows, plotCols)))
    vplayout <- function(x, y)
        viewport(layout.pos.row = x, layout.pos.col = y)

    # Make each plot, in the correct location
    for (i in 1:numPlots) {
        curRow = ceiling(i/plotCols)
        curCol = (i-1) %% plotCols + 1
        print(plots[[i]], vp = vplayout(curRow, curCol ))
    }

}
使用3行2列的布局进行6个绘图的尝试(其中包括JD Long的4个绘图和两个奖励绘图!):
set.seed(2)
q1 <- ggplot(data.frame(x=rnorm(50)), aes(x)) + geom_density()
q2 <- ggplot(data.frame(x=rnorm(50)), aes(x)) + geom_density()
q3 <- ggplot(data.frame(x=rnorm(50)), aes(x)) + geom_density()
q4 <- ggplot(data.frame(x=rnorm(50)), aes(x)) + geom_density()
q5 <- ggplot(data.frame(x=rnorm(50)), aes(x)) + geom_density()
q6 <- ggplot(data.frame(x=rnorm(50)), aes(x)) + geom_density()

multiplot(q1, q2, q3, q4, q5, q6, cols=2)
给出这个图:
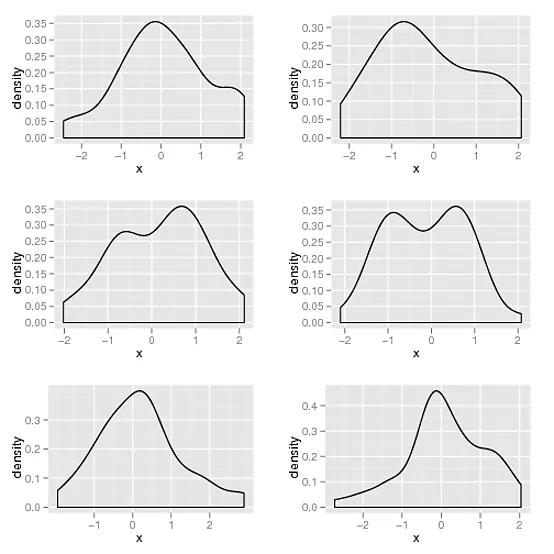
如果这个函数并不完全符合您的需求,但至少它可以为您提供一个不错的起点!
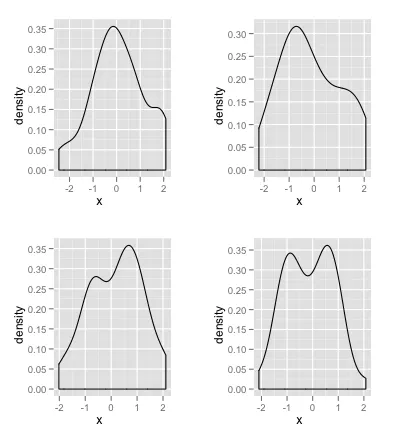
感谢Andrie和Harlan之前对我问题的评论和答案!我根据他们的建议制作了这个解决方案,达到了我想要的效果:
set.seed(2)
q1 <- ggplot(data.frame(x=rnorm(50)), aes(x)) + geom_density()
q2 <- ggplot(data.frame(x=rnorm(50)), aes(x)) + geom_density()
q3 <- ggplot(data.frame(x=rnorm(50)), aes(x)) + geom_density()
q4 <- ggplot(data.frame(x=rnorm(50)), aes(x)) + geom_density()

grid.newpage()
pushViewport(viewport(layout=grid.layout(2,2)))
vplayout <- function(x,y) viewport(layout.pos.row=x,layout.pos.col=y)
print(q1,vp=vplayout(1,1))
print(q2,vp=vplayout(1,2))
print(q3,vp=vplayout(2,1))
print(q4,vp=vplayout(2,2))
得到的结果如下:
截至2018年7月,有几个软件包可以帮助很好地创建多面板图。请参见下面的示例
library(ggplot2)
theme_set(theme_bw())

q1 <- ggplot(mtcars) + geom_point(aes(mpg, disp))
q2 <- ggplot(mtcars) + geom_boxplot(aes(gear, disp, group = gear))
q3 <- ggplot(mtcars) + geom_smooth(aes(disp, qsec))
q4 <- ggplot(mtcars) + geom_bar(aes(carb))
library(grid)
library(egg)

ggarrange(q1, q2, q3, q4,
          ncol = 2,
          top = "Plot title",
          bottom = textGrob(
            "This footnote is right-justified",
            gp = gpar(fontface = 3, fontsize = 10),
            hjust = 1, x = 1)
          )
#> `geom_smooth()` using method = 'loess' and formula 'y ~ x'

library(cowplot)

plot_grid(q1, q2, q3, q4,
          ncol = 2,
          labels = "AUTO")
#> `geom_smooth()` using method = 'loess' and formula 'y ~ x'

library(patchwork)

q1 + q2 + q3 + q4 +
  plot_layout(ncol = 2) +
  plot_annotation(title = "Plot title",
                  subtitle = "Plot subtitle",
                  tag_levels = 'A',
                  tag_suffix = ')')
#> `geom_smooth()` using method = 'loess' and formula 'y ~ x'

# complex layout 1
q1 + {
  q2 + plot_spacer() + {
    q3 +
      q4 +
      plot_layout(ncol = 1)
  }
} +
  plot_layout(ncol = 1)
#> `geom_smooth()` using method = 'loess' and formula 'y ~ x'

# complex layout 2
(q1 | q2 | q3) /
  q4
#> `geom_smooth()` using method = 'loess' and formula 'y ~ x'

# bonus: working with grob objects
p1 <- ggplot(mtcars) + geom_boxplot(aes(gear, disp, group = gear))
table1 <- tableGrob(mtcars[1:6, 1:4])
patchwork::wrap_plots(list(p1, table1), nrow = 1)

library(magrittr)
library(multipanelfigure)

figure1 <- multi_panel_figure(columns = 2, rows = 2, panel_label_type = "none")
# show the layout
figure1

figure1 %<>%
  fill_panel(q1, column = 1, row = 1) %<>%
  fill_panel(q2, column = 2, row = 1) %<>%
  fill_panel(q3, column = 1, row = 2) %<>%
  fill_panel(q4, column = 2, row = 2)
#> `geom_smooth()` using method = 'loess' and formula 'y ~ x'
figure1

# complex layout
figure2 <- multi_panel_figure(columns = 3, rows = 3, panel_label_type = "upper-roman")

figure2 %<>%
  fill_panel(q1, column = 1:2, row = 1) %<>%
  fill_panel(q2, column = 3, row = 1) %<>%
  fill_panel(q3, column = 1, row = 2) %<>%
  fill_panel(q4, column = 2:3, row = 2:3)
#> `geom_smooth()` using method = 'loess' and formula 'y ~ x'
figure2

2018年7月6日创建于 reprex包 (v0.2.0.9000)。
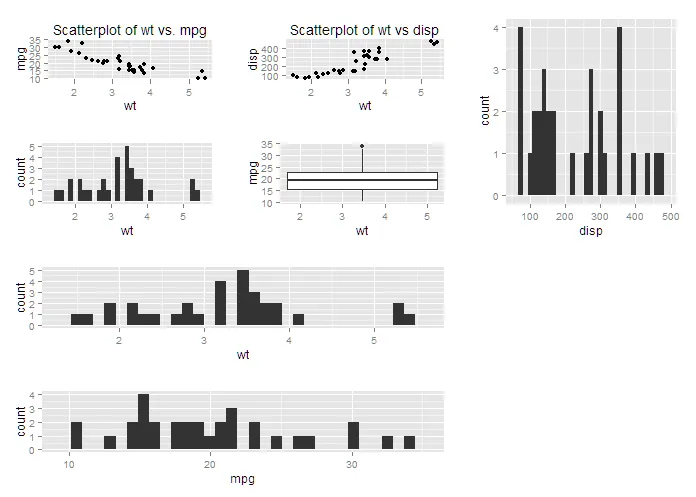
我认为值得更多关注的实用工具是wq::layOut(注意大写字母“O”)。它与base::layout类似,可以对不同大小的图进行布局,并按行和列排列。每个传递给layOut的参数都是一个由3个元素组成的列表,包括图形、要绘制它的行索引和要绘制它的列索引。例如:
library("ggplot2")
# Generate arbitrary ggplots
plot1 <- qplot(data = mtcars, x=wt, y=mpg, geom="point",main="Scatterplot of wt vs. mpg")
plot2 <- qplot(data = mtcars, x=wt, y=disp, geom="point",main="Scatterplot of wt vs disp")
plot3 <- qplot(wt,data=mtcars)
plot4 <- qplot(wt,mpg,data=mtcars,geom="boxplot")
plot5 <- qplot(wt,data=mtcars)
plot6 <- qplot(mpg,data=mtcars)
plot7 <- qplot(disp,data=mtcars)

wq::layOut(list(plot1, 1, 1),
           list(plot2, 1, 2),
           list(plot3, 2, 1),
           list(plot4, 2, 2),
           list(plot5, 3, 1:2),
           list(plot6, 4, 1:2),
           list(plot7, 1:2, 3))