ggplot2 中的面板旋转

11

我觉得我有一个棘手的问题。 我正在使用geom_raster绘制时间内植物疾病水平的演变:x和y是任意领域坐标,z是在几个时间点上测量的疾病水平,我希望每个日期在不同的面板上绘制。

目前为止,没有问题。 以下是一个模拟数据集和代码:

library(ggplot2)
data <- data_frame(month=factor(rep(c("march","april","may","june"), each=100), levels=c("march","april","may","june")),
              x=rep(rep(1:10, each=10), 4),
              y=rep(rep(1:10, 10), 4),
              z=c(rnorm(100, 0.5, 1), rnorm(100, 3, 1.5), rnorm(100, 6, 2), rnorm(100, 9, 1)))
ggplot(data, aes(x=x, y=y, fill=z)) +
  geom_raster(color="white") +
  scale_fill_gradient2(low="white", mid=mean(range(dat$z)), high="red") +
  scale_x_discrete(limit=1:10, expand = c(0, 0)) +
  scale_y_discrete(limit=1:10, expand = c(0, 0)) +
  coord_equal() +
  facet_wrap(~month)

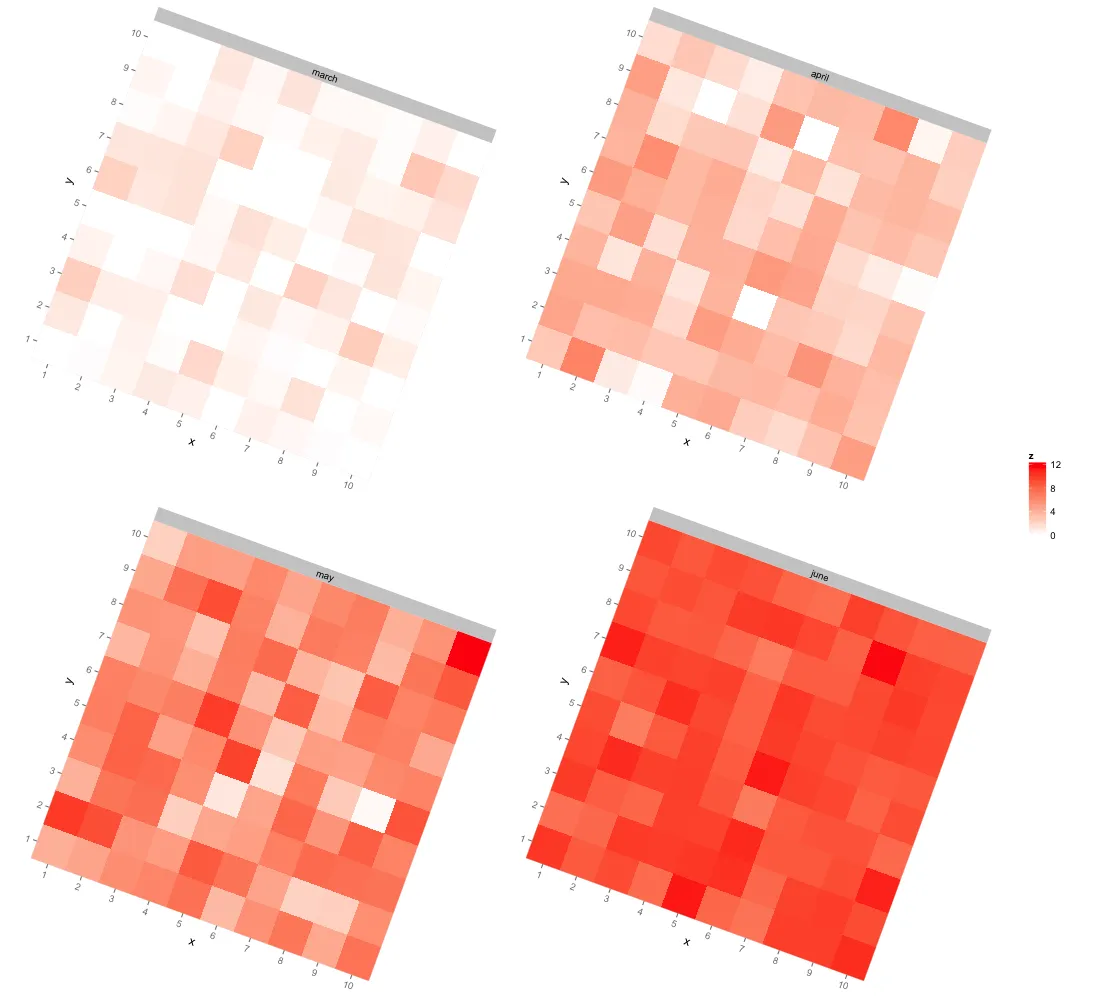
但我真正想要的是,每个分面都以一定的角度旋转(例如15°),以反映我的领域并非完全按照北方方向定位(即顶部不是北方,底部不是南方)。

在ggplot2或任何与网格有关的工具中,是否有自动完成此操作的可能性?即使可以自动将单独的分面保存为图像,将它们旋转,并在新页面上打印旋转后的图像也足以满足我的需求。以下是我想获得的图像示例(在图像编辑器中旋转了15度的分面):

http://imgur.com/RYJ3EaRrotated facets

也许您可以使用ImageMagick的系统调用来解决这个问题,例如参考http://www.r-bloggers.com/animate-gif-images-in-r-imagemagick/ - Marat Talipov
2
难道不能通过旋转数据使其面向北方吗?(例如,通过适当的2x2旋转矩阵进行乘法运算) - asachet
1
我不确定,但我认为你可能会被迫使用已有的后处理软件。据我所知,
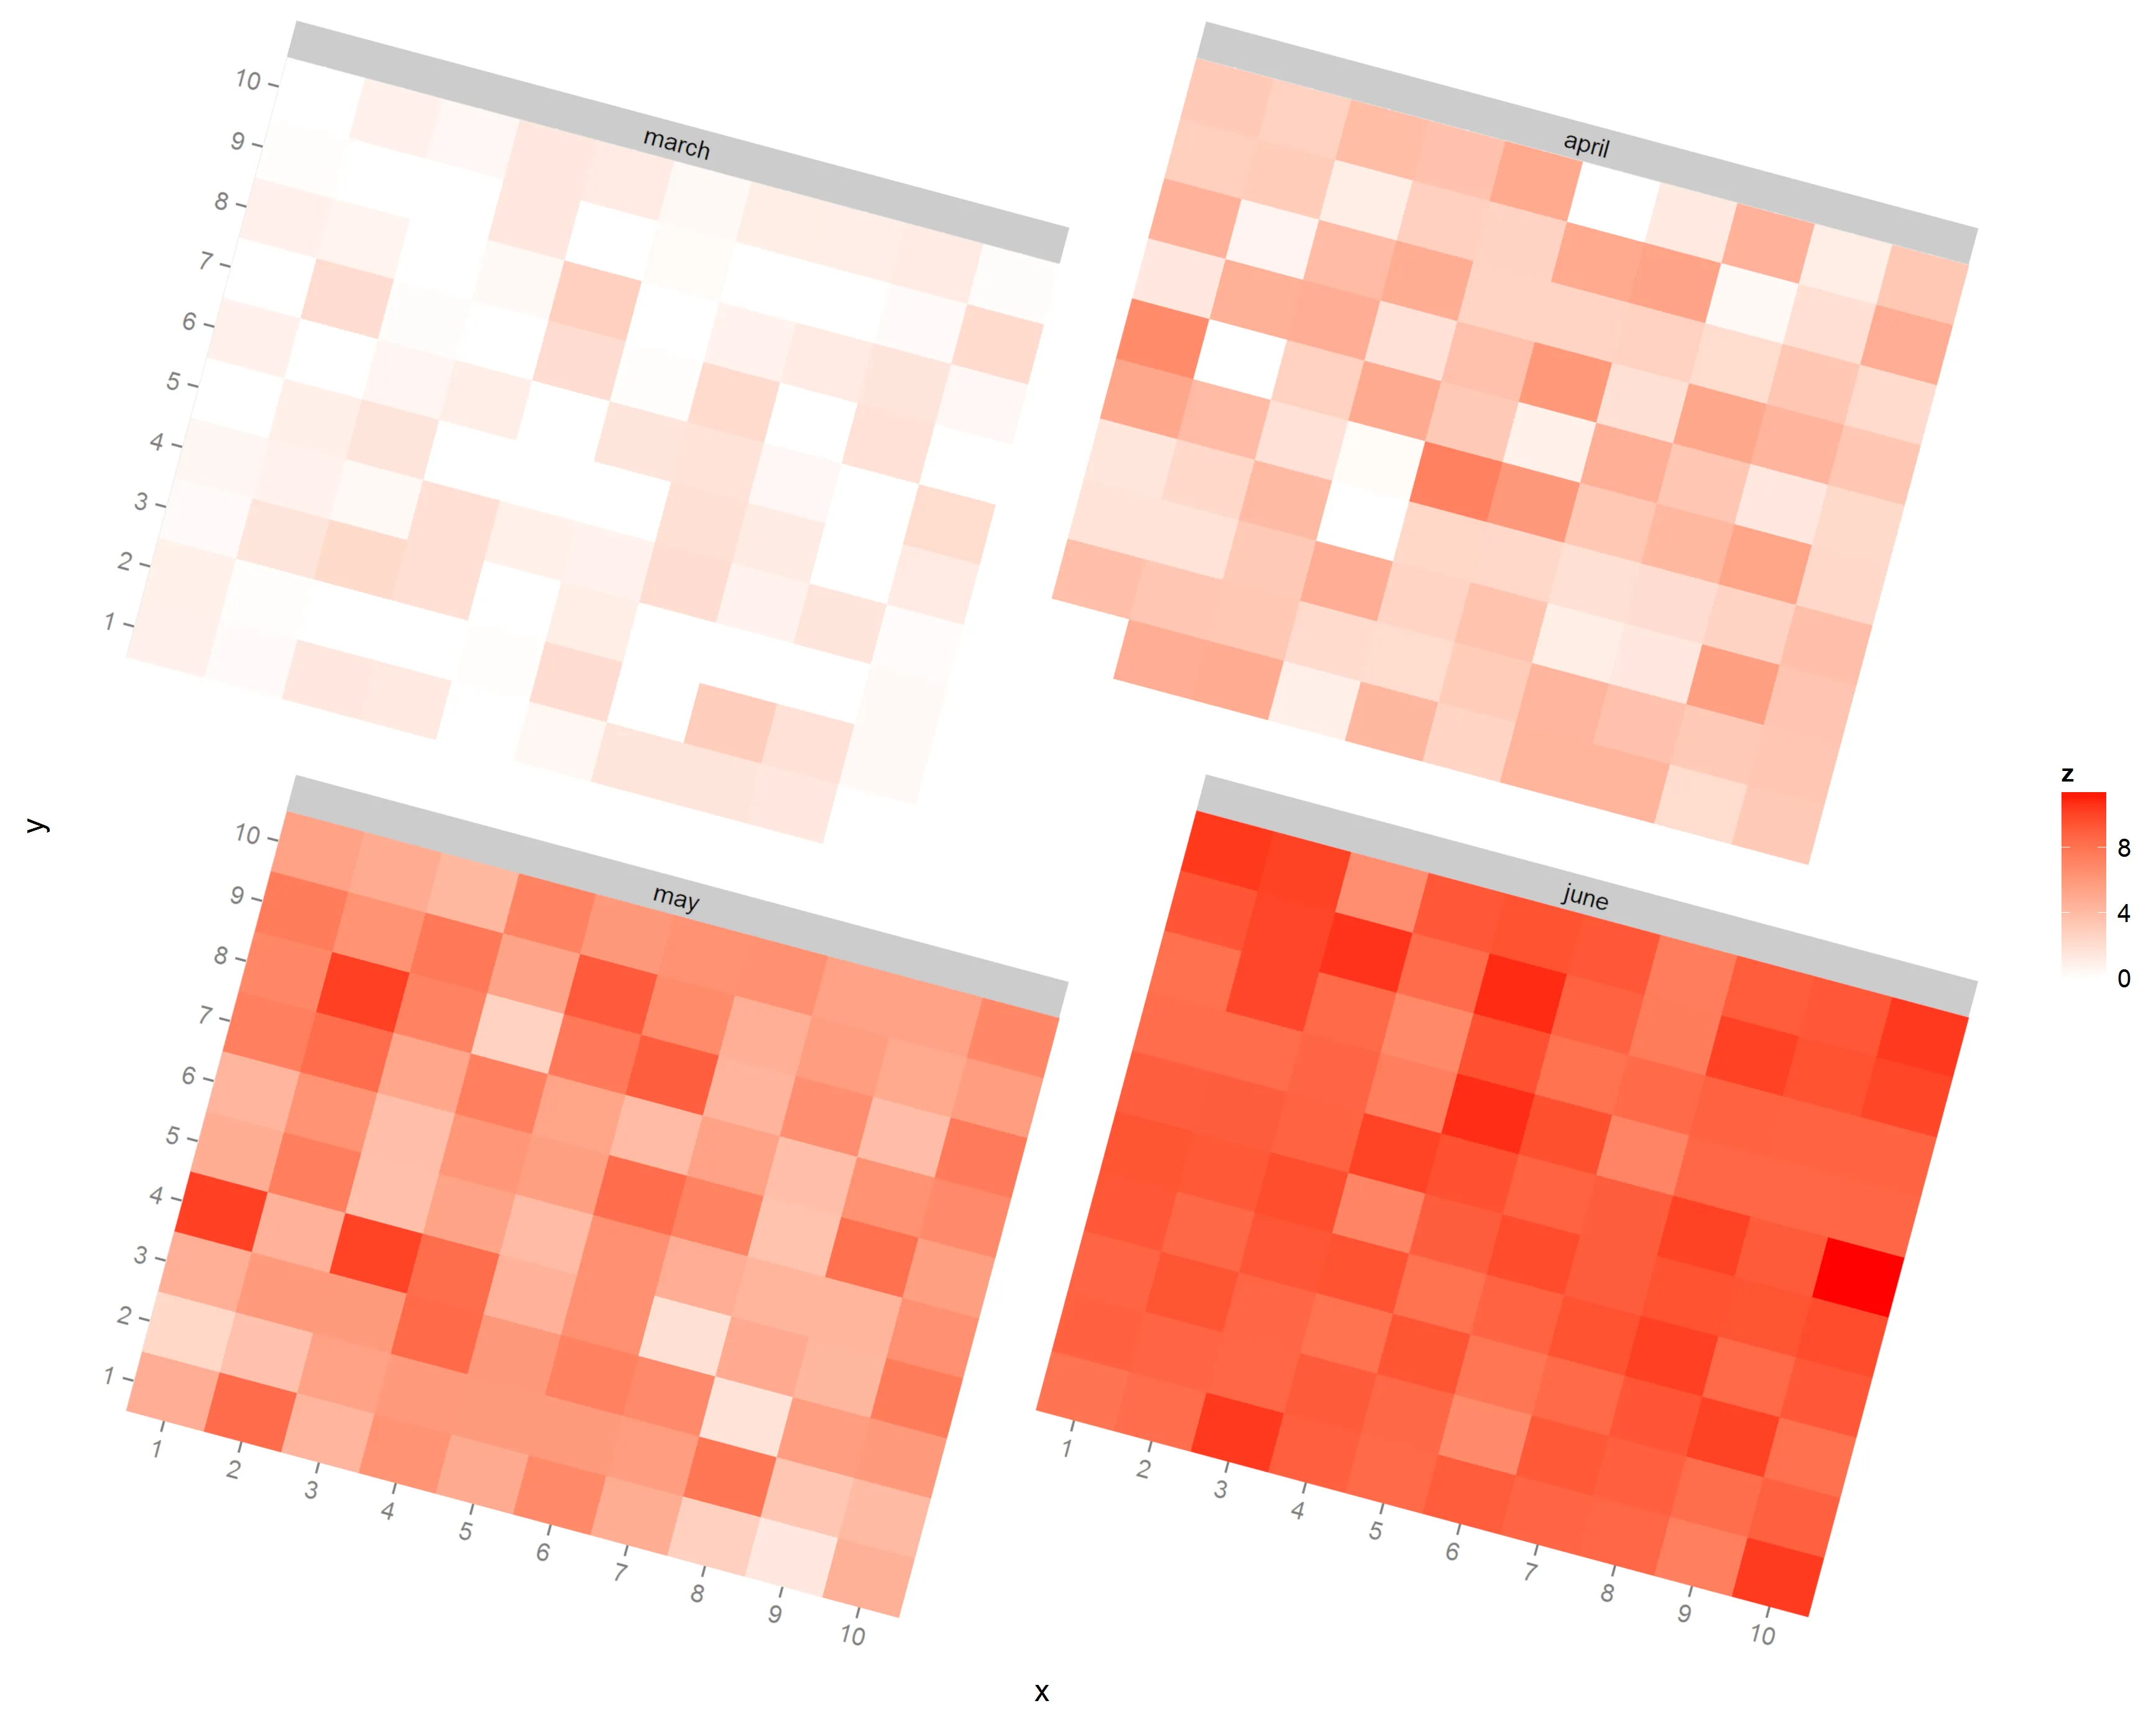
ggplot并不是为处理这种情况而设计的。事实上,我猜图形语法会积极地反对这种情况。 - alexwhitworth
2
这个问题很相关:https://dev59.com/QZDea4cB1Zd3GeqPc4z0 - Roland
@antoine-sac,我不知道你的意思,但如果你能给我一个例子,我会尝试着去做。 - Sebastien Guyader
显示剩余2条评论
1个回答

16

下面是一个独立旋转每个月份水平的方法。我们创建一个列表,包含每个month级别的单独旋转图,并使用grid.arrange将这四个图一起布局。我还从单独的图中删除了图例,并分别绘制了图例。以下代码包括一个帮助函数,用于提取图例。

在下面的lapply函数中,我将图例对象提取到全局环境中(不要忘记重复提取多次)。可能有更好的方法,但这种方法很快。

library(gridExtra)

# Helper function to extract the legend from a ggplot
# Source: https://dev59.com/fWcs5IYBdhLWcg3w1XbZ
g_legend<-function(a.gplot){
  tmp <- ggplot_gtable(ggplot_build(a.gplot))
  leg <- which(sapply(tmp$grobs, function(x) x$name) == "guide-box")
  legend <- tmp$grobs[[leg]]
  legend
}

# Create a list containing a rotated plot for each level of month
pl = lapply(unique(data$month), function(m) {

  # Create a plot for the current level of month
  p1 = ggplot(data[data$month==m,], aes(x=x, y=y, fill=z)) +
    geom_raster(color="white") +
    scale_fill_gradient2(low="white", high="red", 
                         limits=c(floor(min(data$z)), ceiling(max(data$z)))) +
    scale_x_discrete(limit=1:10, expand = c(0, 0)) +
    scale_y_discrete(limit=1:10, expand = c(0, 0)) +
    coord_equal() +
    facet_wrap(~month) 

  # Extract legend into global environment
  leg <<- g_legend(p1)

  # Remove legend from plot
  p1 = p1 + guides(fill=FALSE)

  # Return rotated plot
  editGrob(ggplotGrob(p1), vp=viewport(angle=-20, width=unit(0.85,"npc"), 
                                       height=unit(0.85,"npc")))                    
})

# Lay out the rotated plots and the legend and save to a png file
png("rotated.png", 1100, 1000)
grid.arrange(do.call(arrangeGrob, c(pl, ncol=2)),
             leg, ncol=2, widths=c(0.9,0.1))
dev.off()

在此输入图片描述


不错!在我看来唯一需要改进的是图例,例如在这个例子中,每个分面都会独立绘制图例比例尺,而最好是有一个共同的比例尺。 - Sebastien Guyader
1
我已经添加了一个额外的更新,它使用单个图例创建图形,而不是为每个图形创建单独的图例。 - eipi10
非常感谢eipi10,事实上我正在查看您为另一个问题提供的解决方案(https://dev59.com/EFsX5IYBdhLWcg3wHsdv#34212381),并尝试弄清楚如何实现它。 - Sebastien Guyader

网页内容由stack overflow 提供, 点击上面的
可以查看英文原文,
原文链接