我有以下数据:
    df <- data.frame("Stat" = c("Var1","Var1","Var1","Var1","Var1","Var2","Var2","Var2","Var2","Var2","Var2","Var2","Var2","Var2","Var2","Var2","Var2","Var2","Var2","Var2","Var2","Var2","Var2","Var2","Var2","Var3","Var3","Var3","Var3","Var3","Var3","Var3","Var3","Var3","Var3"),

"Value" = c(0,1,2,3,4,1,2,3,4,5,6,7,8,9,10,11,12,13,14,15,16,17,18,19,20,1,2,3,4,5,6,7,8,9,10),

"n" = c(33,120,223,63,20,17,28,33,22, 35,41,53,44,55,59,39,33, 46,30,29,23,21,14,6,18,7,29,50,80,86,91,83,35,34, 20))
我想做的是将上述数据绘制成一个柱状图,但分为三行(1列x3行)显示,每个面板只包含一个变量(Stat),例如第一个面板中只有Var1的图表,第二个面板中只有Var2的图表,第三个面板中只有Var3的图表。使用以下代码:
library(multipanelfigure)

fig1 <- multi_panel_figure(columns = 2, rows = 2, panel_label_type = "none")

# fit the plots on the panels
fig1 %<>%
  fill_panel(Var1Plot, column = 1, row = 1) %<>%
  fill_panel(Var2Plot, column = 2, row = 1) %<>%
  fill_panel(Var3Plot, column = 1:2, row = 2)

fig1
问题是如何获取Var1Plot,Var2Plot和Var3Plot,以便将它们放置在相应的面板上方。我使用了以下代码,但无法将结果放置在上述面板中:
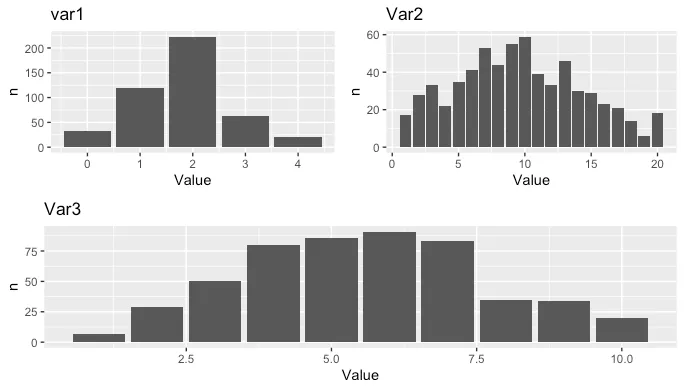
 library(tidyverse)
 df %>% ggplot(aes(x = Value, y = n)) +
  geom_bar(stat='identity') + facet_wrap(~ Stat)
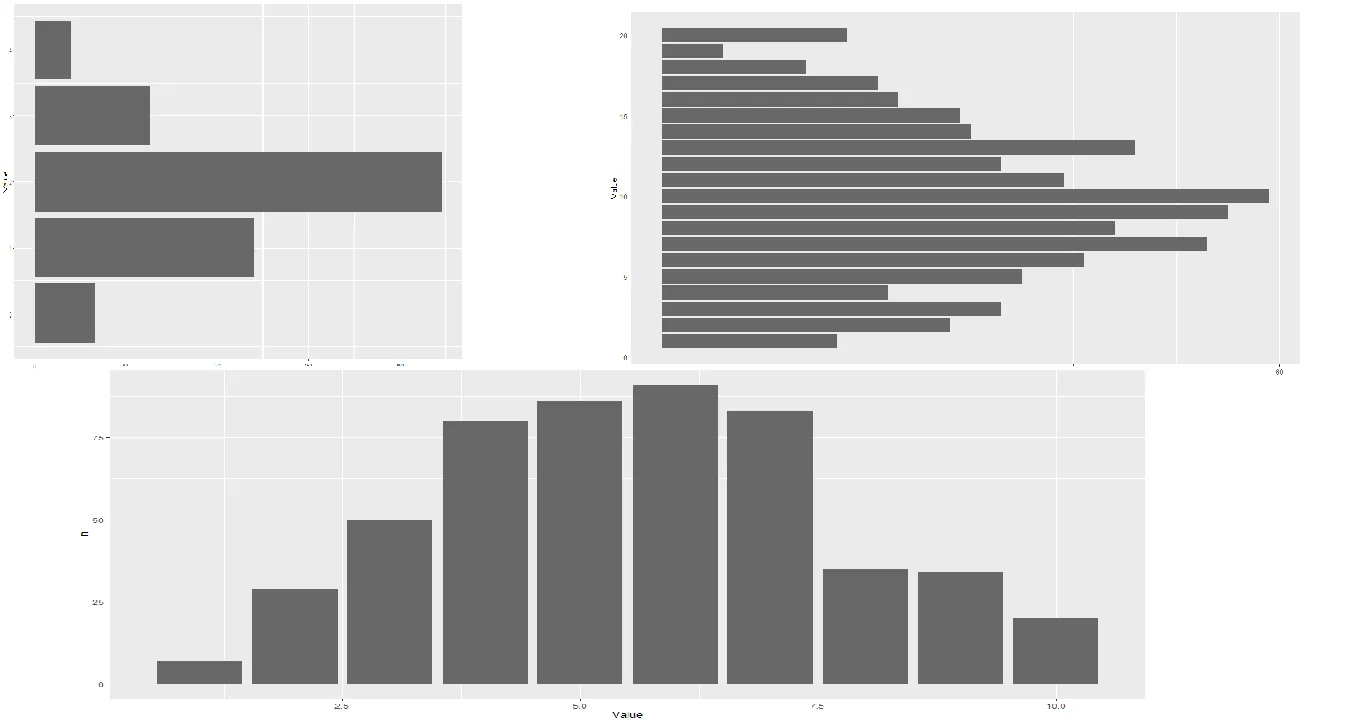
期望的图表应该看起来像这样:
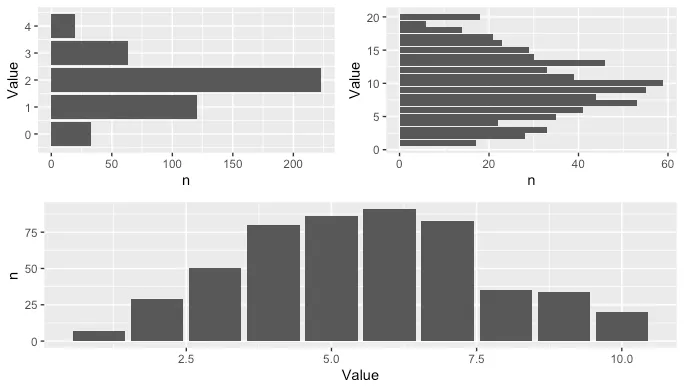
facet_wrap(~ Stat, nrow = 2, ncol = 2)有何不同?也许你可以在画图软件或预览中提供一个模拟图? - Ian Campbell